Mastering Data Collection: Sampling, Surveys, and Experimental Design
Introduction to Data Collection
Statistics is the science of learning from data. Before any analysis can take place, data must be collected properly. In Unit 3, we focus on the critical distinction between describing a sample and making inferences about a population, as well as the difference between correlational observation and causal experimentation.
1. Observational Studies vs. Experiments
The fundamental distinction in data collection is whether the researcher intervenes.
Observational Studies
In an observational study, researchers measure variables of interest without influencing the responses. The goal is to describe a population or find associations between variables.
- Retrospective Studies: Look backward at existing data (e.g., examining medical records of patients who already have a disease to find common risk factors).
- Prospective Studies: Track individuals into the future (e.g., selecting a group of healthy people and following them for 20 years to see who develops heart disease).
Key Limitation: Observational studies can show correlation, but they generally cannot prove causation due to confounding variables.
Example 3.1: The Ebola Epidemic
- Retrospective: Researchers looked at past data (2014–2016) on reported cases to trace the spread of Ebola.
- Prospective: Ongoing surveillance follows survivors to monitor long-term health effects.
Experiments
In an experiment, researchers deliberately impose some treatment on individuals to measure their responses. This is the effectively the only way to establish a cause-and-effect relationship.
Comparison Table
| Feature | Observational Study | Experiment |
|---|---|---|
| Intervention | None (passive observation) | Yes (imposes treatment) |
| Goal | Find associations/trends | Establish causation |
| Key Mechanism | Random Sampling (ideal) | Random Assignment |
| Control | Low (confounding is an issue) | High (can control variables) |
2. Sampling Methods
To know about a Population (the entire group of individuals), we study a Sample (the part of the population we actually examine). A Census is a study that attempts to include every individual in the population.
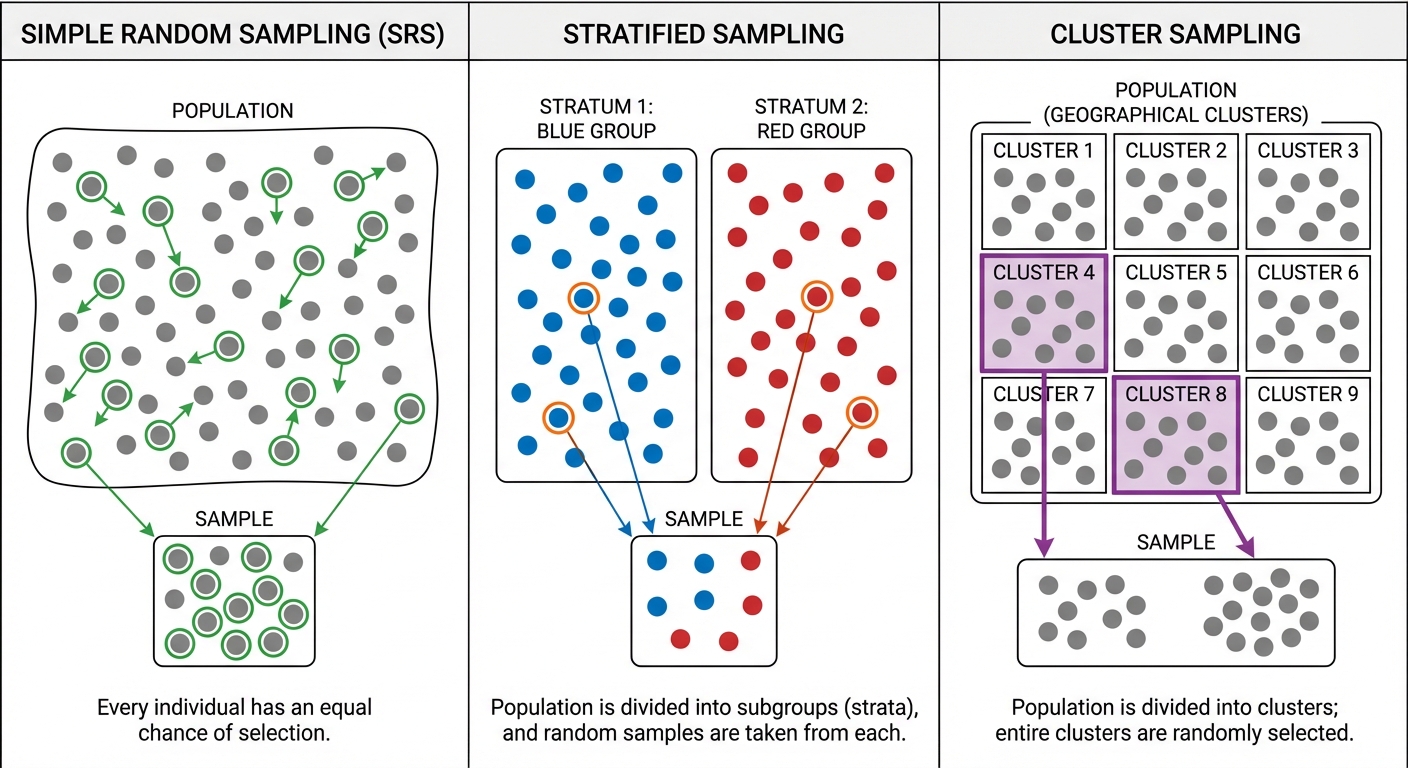
Simple Random Sample (SRS)
An SRS is the gold standard. A sample of size $n$ is an SRS if every group of $n$ individuals in the population has an equal chance of being selected.
How to conduct an SRS (The "Hat Method" vs. Technology):
- Label: Assign a unique number to every individual in the population.
- Randomize: Use a random number generator (RNG) or a random digit table to select $n$ unique numbers.
- Select: Identify the individuals corresponding to the selected numbers.
Stratified Random Sampling
Divide the population into homogeneous groups called strata (groups that share a characteristic likely to affect the response, e.g., age, gender). Then, take a separate SRS from each stratum and combine them.
- Mnemonic: "Some from all." (Take some people from all groups).
- Benefit: Reduces variability and ensures all subgroups are represented.
Cluster Sampling
Divide the population into heterogeneous groups called clusters (minipopulations, usually based on location). Randomly select a few whole clusters and include everyone in those selected clusters.
- Mnemonic: "All from some." (Take all people from some groups).
- Benefit: Determining efficiency and reducing cost/travel time.
Systematic Sampling
Select every $k^{th}$ individual from a list (e.g., every 10th person). You must choose a random starting point.
Common Mistakes in Sampling
- Confusing Stratified and Cluster:
- Strata are similar within (homogenous) but different between. (e.g., Grade 9, Grade 10, Grade 11).
- Clusters are different within (heterogenous) but similar between. (e.g., Homeroom A, Homeroom B—both have mix of students).
- Bias vs. Variability:
- Bias is systematic error (aiming at the wrong spot).
- High Variability is scattered results (shots all over the target).
- Large sample sizes reduce variability, but they do NOT fix bias.
3. Sources of Bias in Sampling
Bias occurs when the sampling method consistently overestimates or underestimates the value you want to know. It is a flaw in the design, not just bad luck.
Bad Sampling Methods
- Voluntary Response Sample: People choose themselves to participate (e.g., online polls). These overrepresent people with strong (usually negative) opinions.
- Convenience Sample: Choosing individuals who are easiest to reach. This produces unrepresentative data (e.g., asking your friends to represent the whole school).
Specific Types of Bias
- Undercoverage Bias: Occurs when some members of the population cannot be chosen in a sample (e.g., calling landlines misses people who only have cell phones).
- Nonresponse Bias: Occurs when an individual chosen for the sample helps but cannot be contacted or refuses to participate. The people who don't respond often differ meaningfully from those who do.
- Response Bias: A systematic pattern of incorrect responses. This can be caused by:
- Wording of questions (Leading questions).
- Interviewer influence (Trying to please the interviewer).
- Sensitive topics (Lying about drug use or income).
Example 3.2: The Military Times Survey
- Scenario: The Military Times conducts an opt-in web poll of its readers.
- Bias: Voluntary Response Bias (only motivated readers reply) and Undercoverage (only readers of this specific magazine are eligible).
4. Designing Experiments
To establish causation, we need a rigorous structure. The terminology is strict:
- Experimental Units: The individuals on which the experiment is done. (Called Subjects if they are human).
- Explanatory Variable (Factor): What is being manipulated (e.g., Temperature).
- Levels: The specific values of the factor (e.g., 50°F, 70°F, 90°F).
- Treatments: The specific experimental condition applied to the units. (If there is 1 factor, treatments = levels. If multiple factors, treatments = combinations of levels).
- Response Variable: The outcome being measured.
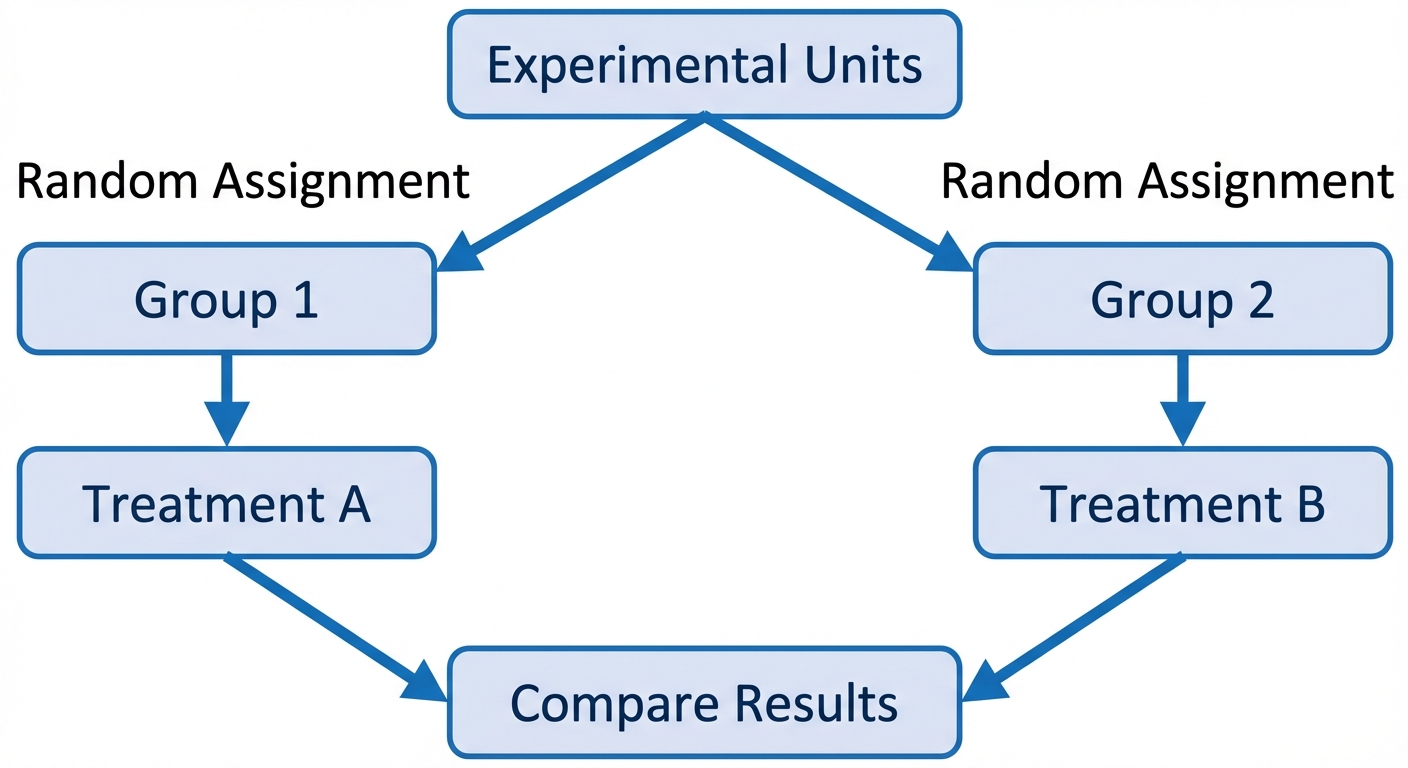
The Four Principles of Experimental Design
- Comparison: Use a design that compares two or more treatments.
- Random Assignment: Use chance to assign experimental units to treatments. This creates roughly equivalent groups by balancing lurking variables.
- Control: Keep other variables that might affect the response the same for all groups (prevents confounding).
- Replication: Use enough experimental units in each group so that any differences in the effects of the treatments can be distinguished from chance differences between the groups.
Key Concepts in Experiments
- Control Group: A group that receives no treatment, an inactive treatment (placebo), or an existing baseline treatment. It provides a baseline for comparison.
- Placebo Effect: The response to a dummy treatment. Many patients improve simply because they believe they are being treated.
- Blinding:
- Single-blind: Subjects do not know which treatment they are receiving.
- Double-blind: Neither the subjects nor the people who interact with them/measure the response know who received which treatment. (Crucial for eliminating researcher bias).
Determining Statistical Significance
An observed effect so large that it would rarely occur by chance is called statistically significant. If the difference between treatment groups is greater than what can be attributed to random variation, we conclude the treatment caused the difference.
5. Advanced Experimental Designs
Completely Randomized Design
All specific experimental units are allocated at random among all specific treatments. This is the simplest structure.
Randomized Block Design
If a group of experimental units is known to be similar in a way that is expected to affect the response to the treatments, we group them into a block.
- Rule: "Block what you can control; randomize what you cannot."
- Procedure: separate subjects into blocks (e.g., Men vs. Women), then randomly assign treatments within each block.
- Why? It reduces variability in the response variable, making it easier to see the true effect of the treatment.
Matched Pairs Design
A common form of blocking for comparing just two treatments.
- Option A: Each subject receives both treatments in a random order. The subject acts as their own control.
- Option B: Subjects are paired up based on similarity (e.g., twins, same age/weight). One randomly gets Treatment A, the other gets Treatment B.
Example 3.8 Revisited: Warts Study
- Completely Randomized: Randomly assign 30 patients to Cryotherapy and 30 to Duct Tape.
- Matched Pairs (Concept): If a patient has two warts, treat one with Cryotherapy and one with Duct Tape (randomly assigning which wart gets which).
6. Scope of Inference
The type of study determines the conclusions you can draw. This depends on how individuals were selected and how they were assigned.
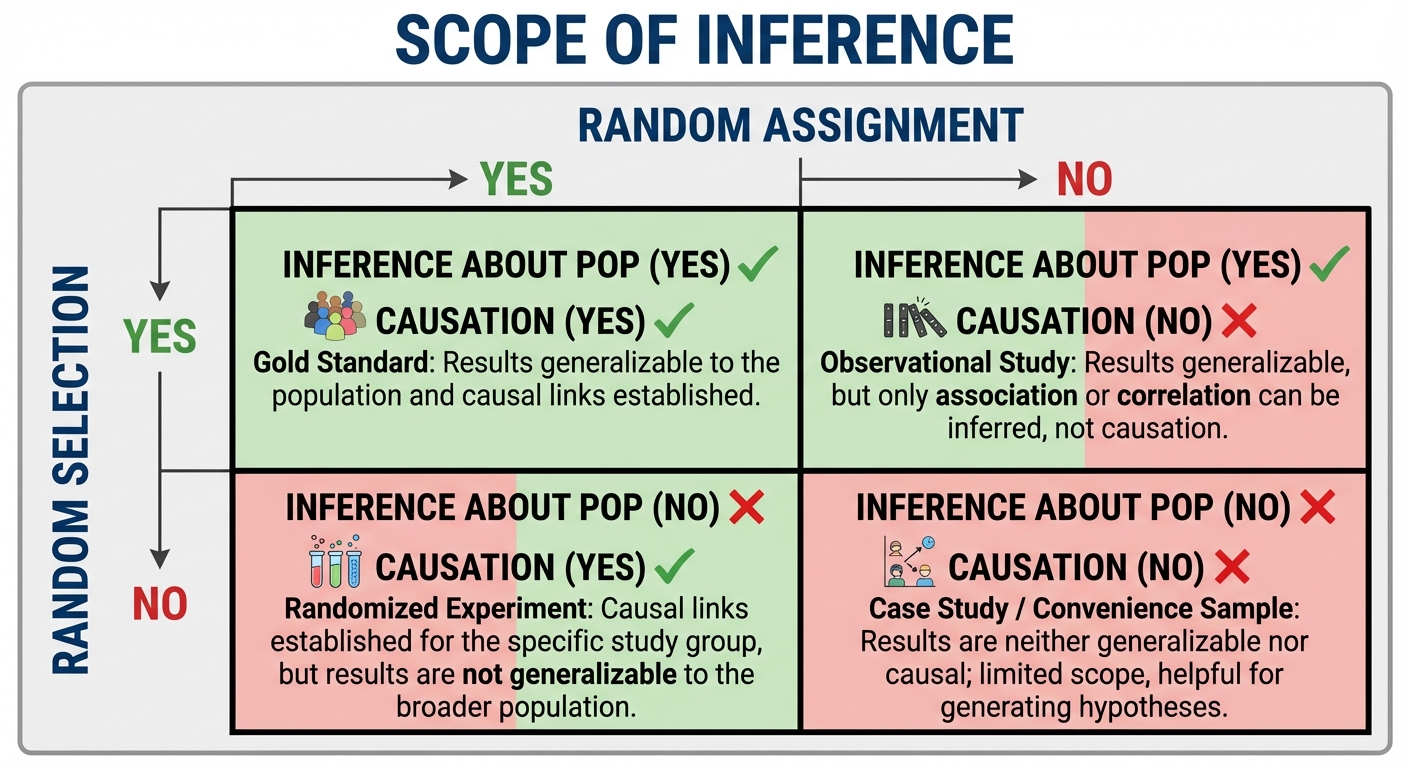
| Random Assignment (Experiment) | No Random Assignment (Obs. Study) | |
|---|---|---|
| Random Selection (from Pop.) | Inference about Population: YES Causation: YES | Inference about Population: YES Causation: NO |
| No Random Selection (Volunteers) | Inference about Population: NO Causation: YES | Inference about Population: NO Causation: NO |
Common Mistakes in Inference
- Generalizing from Volunteers: If you have volunteers for an experiment, you CAN prove causation, but only for people like those volunteers. You generally cannot claim the result holds for the whole population.
- Correlation $\neq$ Causation: Never claim a cause in an observational study, no matter how strong the trend is.
Summary Mnemonics
- Control Variables vs. Control Groups:
- Control variables are kept constant to prevent confounding.
- Control groups are used for comparison.
- Stratified vs. Blocking:
- We stratify when sampling (taking names out of a hat).
- We block when experimenting (assigning treatments).
- Conceptually, they do the same thing: reduce variability.