Demography and Movement: Unit 2 Master Notes
Unit 2: Population and Migration Patterns and Processes
Demography is the statistical study of human populations. In AP Human Geography, this unit focuses on where people live, why they live there, how populations change over time, and the causes/effects of migration.
1. Population Distribution and Density
Physical and Human Factors
Population is not distributed evenly. Humans prefer to live in the ecumene (habitable land).
- Physical Factors: People cluster in mid-latitudes, low-lying areas (access to water/trade), and regions with temperate climates and fertile soil. They avoid dry, wet, cold, and high lands.
- Human Factors: People migrate toward economic opportunity (jobs), political stability, and cultural hubs.
Measuring Density
Density helps geographers understand the pressure population places on the land. You must distinguish between these three types:
Arithmetic Density: The total number of people divided by the total land area.
- Use: Gives a general idea of crowding but ignores land quality.
Physiological Density: The number of people per unit of area of arable land (land suitable for agriculture).
- Use: Shows the pressure a population places on the land to produce food. E.g., Egypt has a moderate arithmetic density but a massive physiological density because 95% of people live near the Nile.
Agricultural Density: The number of farmers per unit of arable land.
- Use: Indicates level of development. MDCs (More Developed Countries) have low agricultural density because technology allows few farmers to feed many people. LDCs (Less Developed Countries) have high agricultural density.
Carrying Capacity
This is the maximum population size that the environment can sustain indefinitely, given the food, habitat, water, and other necessities available.
- Overpopulation occurs when the population exceeds the carrying capacity, not just when there are "too many people." It is a ratio of people to resources.
2. Population Composition
Age and Sex Structures
Understanding who makes up a population is as important as how many people there are. We analyze this using Population Pyramids (Age-Sex Structures).
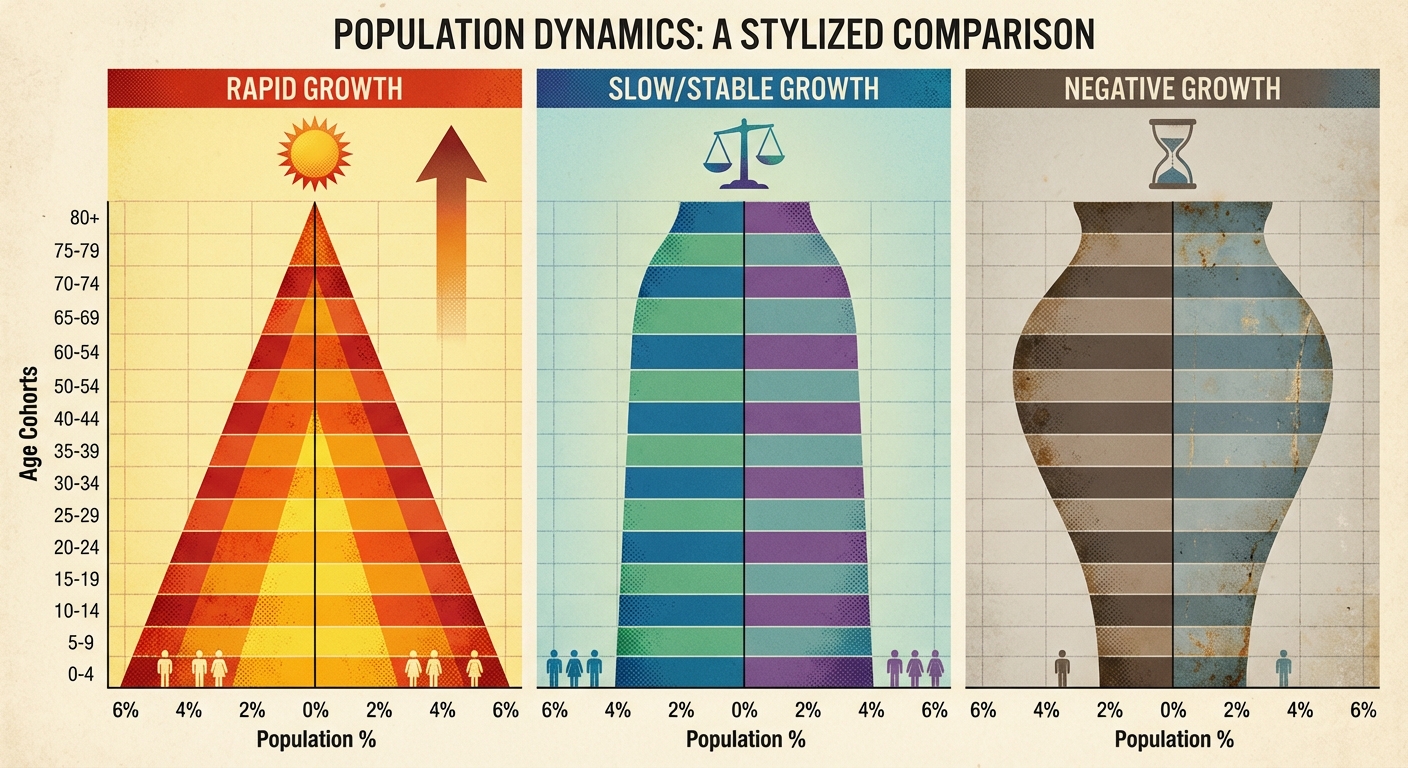
Interpreting Population Pyramids
- Wide Base (Triangle): Rapid growth. High percentage of young people. Indicates an LDC (e.g., Niger, Guatemala).
- Rectangular/Column: Slow or Stable growth. Generations are replacing each other evenly. Indicates an MDC (e.g., United States).
- Inverted Base (Cup shape): Negative growth. The population is shrinking; the elderly outnumber the young. (e.g., Japan, Germany).
- Gaps/Bulges: Specific indentations can show history—war (missing men), famine, or baby booms.
Key Metrics
- Dependency Ratio: The number of people too young (0–14) or too old (65+) to work, compared to the working-age population (15–64).
- High youth dependency = strain on schools/childcare.
- High elderly dependency = strain on pensions/healthcare.
- Sex Ratio: The number of males per 100 females. Distortions occur due to migration (guest workers are often male) or cultural preferences (e.g., skewed ratios in China/India due to son preference).
Common Mistakes:
- Mistaking Arithmetic for Physiological Density: Just because a country is large doesn't mean it can support a lot of people if the land is desert.
- Misreading Pyramids: Remember, males are on the left, females on the right. Usually, 5-year cohorts are used.
3. Population Dynamics and Processes
Vital Statistics
- Crude Birth Rate (CBR): Total live births in a year for every 1,000 people.
- Crude Death Rate (CDR): Total deaths in a year for every 1,000 people.
- Total Fertility Rate (TFR): The average number of children a woman will have during her childbearing years (15–49).
- Replacement Level Fertility: TFR of 2.1. This is the rate needed to keep a population stable (no growth, no decline).
Calculating Growth
- Rate of Natural Increase (NIR/RNI): The percentage by which a population grows in a year. It generally excludes migration.
- Note: If CBR is 20 and CDR is 5, the math is $(20-5)/10 = 1.5\%$.
- Doubling Time: The number of years needed to double a population, assuming constant natural increase.
The Demographic Transition Model (DTM)
The DTM explains how countries transition from high birth/death rates to low birth/death rates as they develop.
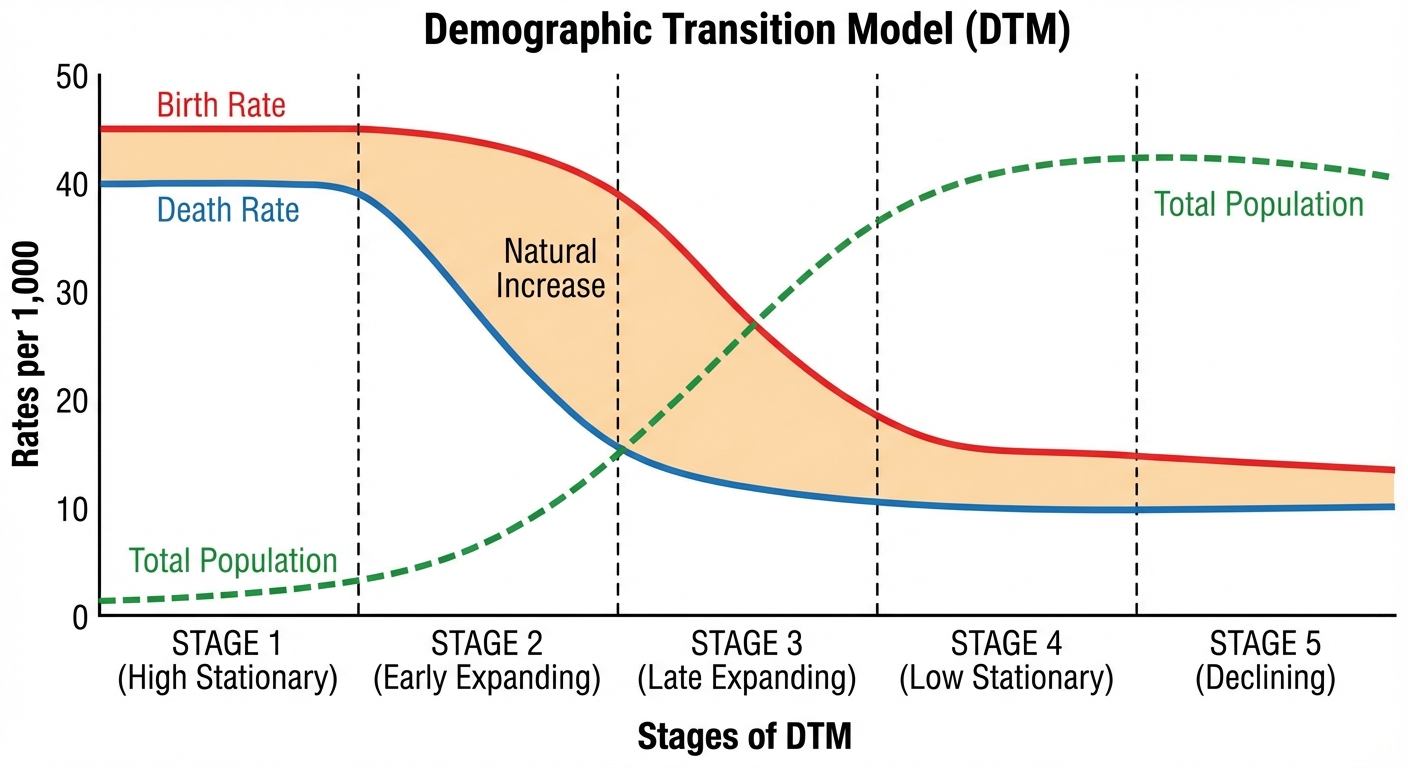
- Stage 1: High Stationary
- High CBR, High CDR = Low NIR.
- Context: Pre-industrial, subsistence farming, pestilence.
- Examples: No entire country is currently in Stage 1; only isolated remote tribes.
- Stage 2: Early Expanding
- High CBR, Rapidly Declining CDR = Very High NIR.
- Context: Industrial Revolution (MDCs) or Medical Revolution (LDCs). improved sanitation and food supply.
- Examples: Sub-Saharan Africa (Mali, South Sudan).
- Stage 3: Late Expanding
- Declining CBR, Slowly Declining CDR = Moderate NIR.
- Context: Urbanization, women entering the workforce, cost of raising kids rises.
- Examples: Mexico, India, Turkey, NICs (Newly Industrialized Countries).
- Stage 4: Low Stationary
- Low CBR, Low CDR = Low/Zero Growth (ZPG).
- Context: Service-based economy, high female empowerment.
- Examples: USA, China, Australia.
- Stage 5: Declining
- Very Low CBR (below CDR), Rising CDR (due to old age) = Negative NIR.
- Context: Aging population, labor shortages.
- Examples: Japan, Germany, Eastern Europe.
Epidemiological Transition Model (ETM)
Correlates with the DTM but focuses on causes of death.
- Stages 1-2 (Pestilence & Famine): Infectious/Parasitic diseases (Black Plague, Malaria, Cholera).
- Stages 3-4 (Degenerative Diseases): Chronic diseases associated with aging and lifestyle (Heart disease, Cancer, Diabetes).
- State 5 (Reemergence): Potential return of infectious diseases due to antibiotic resistance or global travel (e.g., SARS, COVID-19).
4. Population Theories and Policies
Malthusian Theory
Thomas Malthus (1798) predicted that population grows geometrically (exponentially) while food supply grows only arithmetically (linearly).
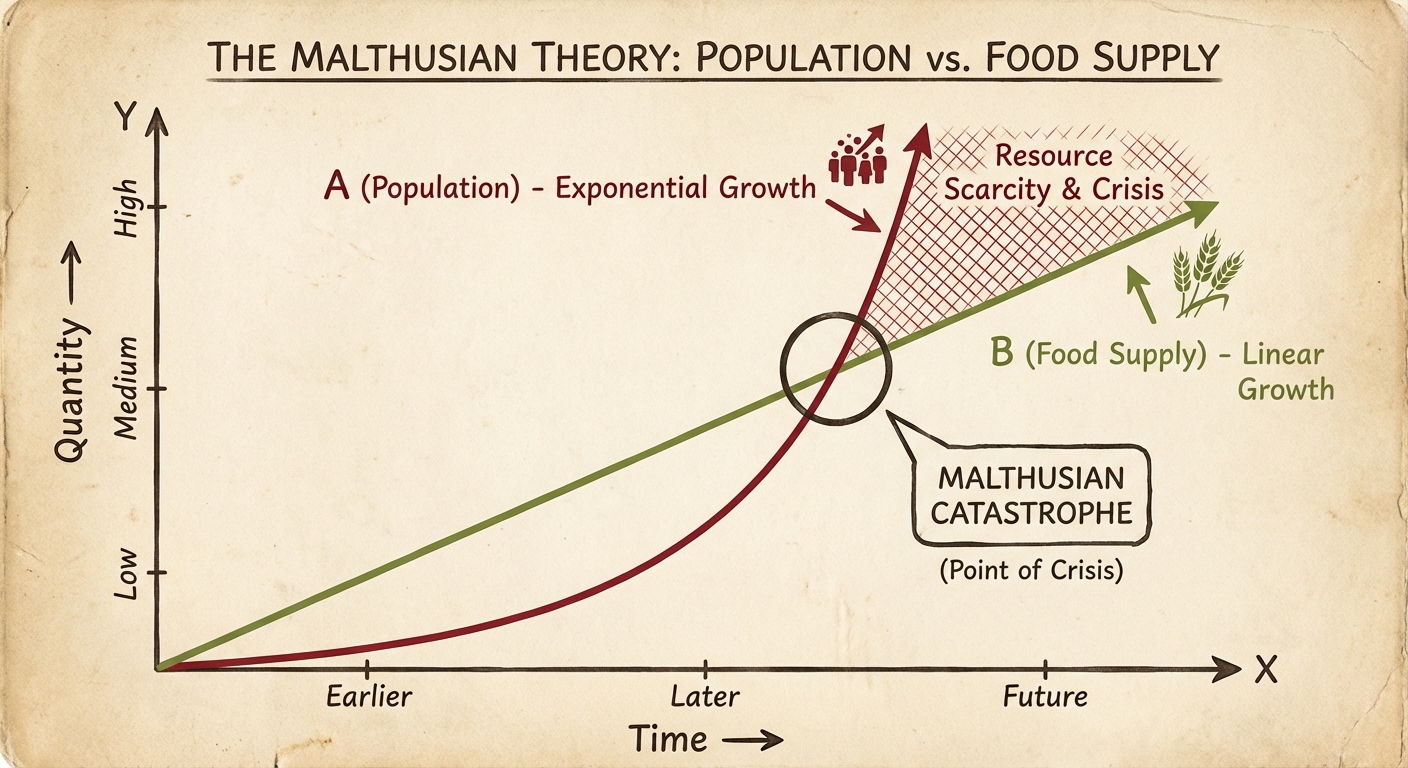
- Malthusian Catastrophe: The point where population exceeds food resources, leading to famine, war, or disease (checks on population).
- Neo-Malthusians: Modern supporters who argue Malthus was essentially right but expand the concern to all resources (energy, water, clean air), not just food.
- Critics (Boserup Theory): Esther Boserup argued that population growth stimulates innovation. Humans will invent new agricultural methods (Green Revolution, GMOs) to meet demand.
Population Policies
Governments enact policies to influence TFR.
- Pro-natalist Policies: Encourage births. (Ex: France/Sweden offering free childcare, tax breaks, paid maternity leave). Used in Stage 4/5 countries.
- Anti-natalist Policies: Discourage births. (Ex: China's former One-Child Policy, India's sterilization campaigns). Used in Stage 2/3 countries.
Women and Demographic Change
Evidence shows the single most effective way to lower TFR is educating women. When women have access to education and employment:
- They marry later.
- They understand and access contraceptives.
- The opportunity cost of having children increases.
5. Migration
Migration is the permanent or semi-permanent relocation of people.
Types of Migration
- Transnational (International): Crossing country borders.
- Internal: Moving within a country (e.g., Rural-to-Urban).
- Chain Migration: People move to a specific location because relatives or members of the same nationality previously migrated there.
- Step Migration: Migration occurs in stages (e.g., Farm $\rightarrow$ Village $\rightarrow$ Town $\rightarrow$ Big City).
Forced vs. Voluntary
- Voluntary Migration: Choice made usually for economic improvement.
- Forced Migration: Compelled to move by cultural/political factors (war, persecution).
- Refugee: Forced to migrate internationally to avoid conflict/persecution.
- Internally Displaced Person (IDP): Forced to migrate like a refugee but has not crossed an international border.
- Asylum Seeker: Someone who has migrated to another country in hopes of being recognized as a refugee.
Why Do People Migrate? (Push and Pull Factors)
- Push Factors (Negative): Induce people to move out.
- Economic: Unemployment, poverty.
- Social/Political: War, persecution, slavery.
- Environmental: Drought, flood, desertification.
- Pull Factors (Positive): Induce people to move in.
- Economic: Jobs, high wages.
- Social/Political: Freedom, democracy, safe communities.
- Environmental: Favorable climate, mountains, seaside.
Ravenstein’s Laws of Migration
19th-century geographer E.G. Ravenstein established patterns still relevant today:
- Most migrants move only a short distance (Distance Decay).
- Long-distance migrants usually head to major economic hubs (Gravity Model).
- Most migration is rural to urban.
- Counter-migration exists (every flow generates a return flow).
- Young adults are more likely to migrate than families.
Effects of Migration
- Historical: The "Great Migration" of African Americans from US South to North; the Westward expansion.
- Brain Drain: Large-scale emigration of talented/educated people (doctors, engineers) from LDCs to MDCs.
- Remittances: Money sent back home by migrants to their family. This is a massive part of the economy for many LDCs.
Common Mistakes:
- Refugee vs. IDP: The only difference is the crossing of a border. IDPs stay in their own country.
- Malthus: Students forget that Malthus failed to predict agricultural technology (The Green Revolution), which is why his gloomiest predictions didn't come true.
- NIR Calculation: Do not forget to divide by 10. (CBR - CDR) gives you a raw number per thousand. NIR is a percentage (per hundred).