Market Mechanics: Interactions of Buyers and Sellers
These study notes cover the foundational mechanisms of the Market Economic System (Capitalism). While AP Macroeconomics largely focuses on the aggregate economy, understanding the microeconomic behaviors of Demand and Supply is a mandatory prerequisite for analyzing Aggregate Demand and Aggregate Supply later in the course.
The Fundamentals of Demand
Demand is defined as the desire to own something combined with the ability to pay for it. It represents the behavior of consumers (buyers) in a market.
The Law of Demand
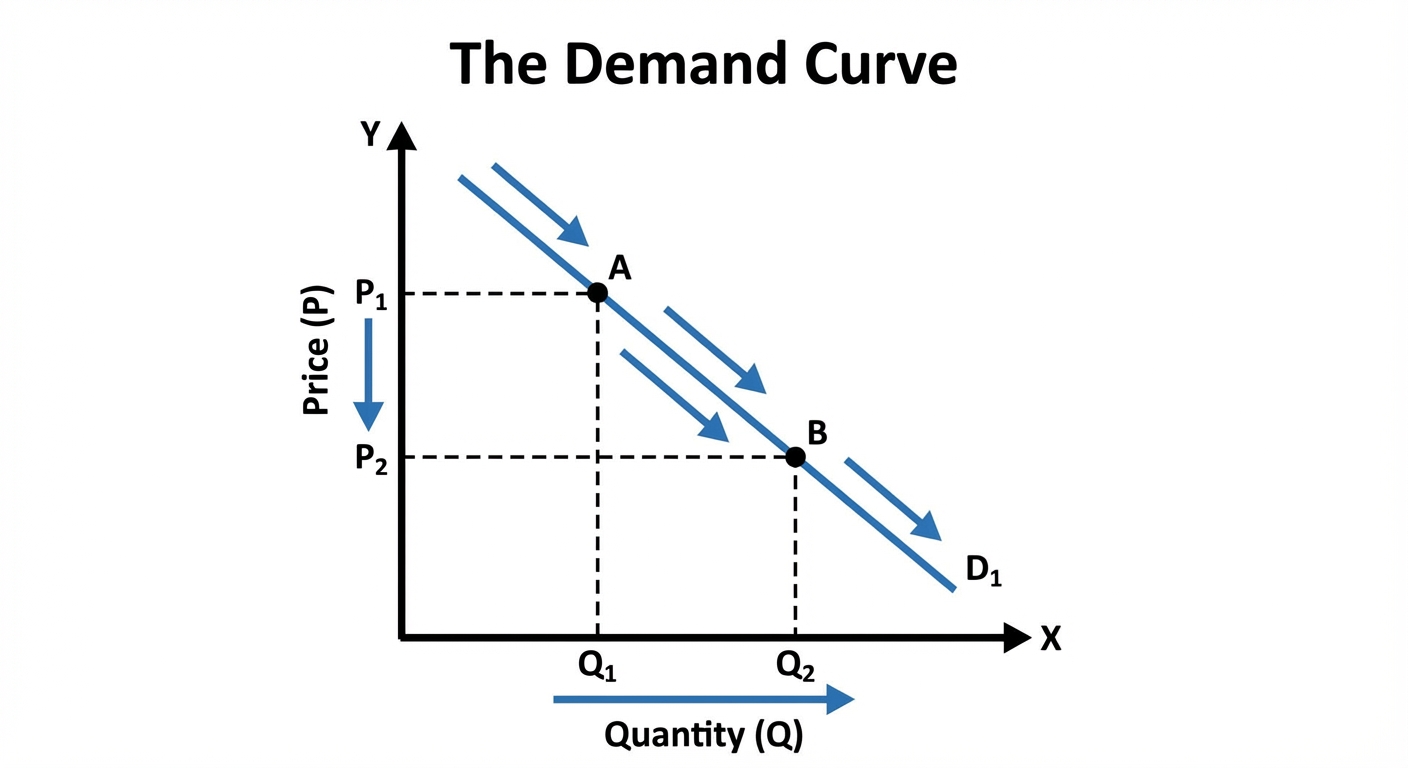
There is an inverse relationship between price and quantity demanded.
- As Price ($P$) increases, Quantity Demanded ($Q_d$) decreases.
- As Price ($P$) decreases, Quantity Demanded ($Q_d$) increases.
This negative slope occurs due to three specific economic concepts:
- The Substitution Effect: If the price of Good A rises, consumers buy less of Good A and more of a relatively cheaper substitute (Good B).
- The Income Effect: If the price of a good falls, the consumer's purchasing power increases, allowing them to purchase more.
- Law of Diminishing Marginal Utility: As you consume more units of a specific good, the additional satisfaction (utility) from each subsequent unit declines. Therefore, you are only willing to buy more if the price is lower.
Change in Quantity Demanded vs. Change in Demand
This is the single most important distinction in this unit.
- Change in Quantity Demanded ($Q_d$): Caused ONLY by a change in the current price of the good itself. This is shown as a movement along the curve.
- Change in Demand ($D$): Caused by a non-price determinant (shifter). This shifts the entire curve left or right.
- Right Shift: Increase in Demand (at every price, people want more).
- Left Shift: Decrease in Demand (at every price, people want less).
Determinants of Demand (Shifters)
Use the mnemonic ME RIT (or TRIBE) to remember what shifts the curve:
- Market Size (Number of Consumers): More population = Shift Right.
- Expectations: If consumers expect prices to rise in the future, they buy now (Shift Right).
- Related Goods Prices:
- Substitutes: If Price of Pepsi $\uparrow$, Demand for Coke $\uparrow$ (Direct relationship).
- Complements: If Price of Peanut Butter $\uparrow$, Demand for Jelly $\downarrow$ (Inverse relationship).
- Income:
- Normal Goods: Income $\uparrow$ $\rightarrow$ Demand $\uparrow$ (e.g., new cars).
- Inferior Goods: Income $\uparrow$ $\rightarrow$ Demand $\downarrow$ (e.g., ramen noodles, used cars).
- Tastes and Preferences: Trends, fashion, and advertising shifting favorability.
The Fundamentals of Supply
Supply represents the willingness and ability of producers (sellers) to produce and sell a product at various prices.
The Law of Supply
There is a direct relationship between price and quantity supplied.
- As Price ($P$) increases, Quantity Supplied ($Q_s$) increases.
- As Price ($P$) decreases, Quantity Supplied ($Q_s$) decreases.
Why? At higher prices, the potential for profit increases, incentivizing producers to allocate more resources to the production of that good.

Determinants of Supply (Shifters)
Just like demand, a change in Price causes a movement along the curve ($Q_s$), while external factors shift the whole curve ($S$).
Use the mnemonic TRICE to remember the shifters:
- Technology: Improvements in tech make production more efficient $\rightarrow$ Shift Right.
- Related Goods (in production): If a producer farms corn and wheat, and the price of corn skyrockets, they will shift resources to corn, decreasing the supply of wheat.
- Inputs (Resource Prices): The cost of land, labor, or capital. If input costs rise, supply decreases (Shift Left).
- Competition (Number of Sellers): More firms entering the market $\rightarrow$ Shift Right.
- Expectations: If a producer expects they can sell for a higher price next month, they may hold back inventory now (Supply decreases now).
- Note on Government Action: Taxes are treated as input costs (Shift Left); Subsidies are treated as lowered costs (Shift Right).
Market Equilibrium and Disequilibrium
Equilibrium
A market exists in Equilibrium when the quantity consumers are willing to buy equals the quantity producers are willing to sell.
Graphically, this is the intersection of the Supply and Demand curves. This point determines the Market Clearing Price ($Pe$) and Equilibrium Quantity ($Qe$).
Disequilibrium: Shortages and Surpluses
When the market price is set somewhere other than equilibrium ($P_e$), disequilibrium occurs.
- Surplus (Excess Supply): Occurs when Price is above Equilibrium.
- $Qs > Qd$
- Resolution: Producers will lower prices to clear excess inventory, moving the market back toward $P_e$.
- Shortage (Excess Demand): Occurs when Price is below Equilibrium.
- $Qd > Qs$
- Resolution: Consumers bid up prices for scarce goods, causing price to rise back toward $P_e$.

Analyzing Market Changes
One of the most frequent exam questions asks what happens to $Pe$ and $Qe$ when a shift occurs.
Single Shifts
- Demand Increases: Price $\uparrow$, Quantity $\uparrow$
- Demand Decreases: Price $\downarrow$, Quantity $\downarrow$
- Supply Increases: Price $\downarrow$, Quantity $\uparrow$
- Supply Decreases: Price $\uparrow$, Quantity $\downarrow$
Double Shifts
When BOTH Supply and Demand shift simultaneously, the change in one variable (Price or Quantity) will be known, but the other will be Indeterminate (Ambiguous). This depends on the magnitude of the shifts.
| Scenario | Demand Shift | Supply Shift | Effect on Price ($P$) | Effect on Quantity ($Q$) |
|---|---|---|---|---|
| 1 | Increase ($\rightarrow$) | Increase ($\rightarrow$) | Indeterminate | Increase |
| 2 | Decrease ($\leftarrow$) | Decrease ($\leftarrow$) | Indeterminate | Decrease |
| 3 | Increase ($\rightarrow$) | Decrease ($\leftarrow$) | Increase | Indeterminate |
| 4 | Decrease ($\leftarrow$) | Increase ($\rightarrow$) | Decrease | Indeterminate |
Tip: Draw both curves shifting. If Price moves up in one shift and down in the other, the net effect is indeterminate without math.

Common Mistakes & Pitfalls
"Change in Demand" vs "Change in Quantity Demanded":
- Mistake: Saying "The price went up, so demand went down."
- Correction: "The price went up, so quantity demanded went down." Demand refers to the whole curve; Quantity Demanded is a specific point.
Confusing Supply Vertical Shifts:
- Mistake: Thinking an "Increase in Supply" means the line moves UP physically.
- Correction: Focus on Left vs. Right. An Increase in Supply is a shift to the Right (which looks physically lower on the graph). Think: "At the same price, suppliers offer more quantity."
Double Shift Certainty:
- Mistake: Claiming both Price and Quantity increase when Demand rises and Supply falls.
- Correction: In a double shift, one variable is always indeterminate unless you are given specific numbers. If Demand rises and Supply falls, Price definitely rises, but Quantity depends on which curve shifted more.
Future Price Expectations:
- Mistake: Confusing Buyer vs. Seller expectations.
- Correction: If Buyers think price will go up later, Demand rises now. If Sellers think price will go up later, Supply drops now (they hoard goods to sell later).