AP Macroeconomics Study Guide: Open Economy Mechanics
Here is a comprehensive review of Unit 6: Open Economy. This section focuses on how money and goods flow between nations and how currencies are valued.
Balance of Payments Accounts
The Balance of Payments (BoP) is a summary record of all international economic transactions between residents of a specific country and the rest of the world during a given period of time. It acts as the country's ledger.
Transactions are recorded as either:
- Credit (+): Money flows into the country (e.g., exporting cars, foreigners buying domestic stock).
- Debit (-): Money flows out of the country (e.g., importing bananas, domestic citizens buying foreign bonds).
The BoP is divided into two primary sub-accounts. Since every transaction has two sides, the overarching identity is:
1. The Current Account (CA)
This account records transactions involving goods, services, and current transfers. It measures the net trade of goods and services.
Components of the Current Account:
- Balance of Trade (Net Exports): The difference between the value of exports and imports of goods and services ($X - M$). This is the largest component.
- Net Foreign Income: Income earned by domestic citizens owning assets abroad minus income earned by foreigners owning domestic assets (e.g., interest payments, dividends).
- Net Unilateral Transfers: One-way money transfers without goods or services in exchange (e.g., foreign aid, remittances sent by workers to families abroad).
2. The Financial Account (CFA)
Often historically referred to as the Capital Account, this records the purchase and sale of financial assets and real assets (not goods).
Components of the Financial Account:
- Foreign Direct Investment (FDI): Purchasing real estate, factories, or businesses in another country.
- Portfolio Investment: Purchasing stocks and bonds.
- Official Reserves: Foreign currencies held by central banks.
| Transaction Type | Example | Account Impacted | Entry |
|---|---|---|---|
| US sells software to France | Export of Service | Current Account | Credit (+) |
| US citizen receives dividends from Japanese stock | Net Income | Current Account | Credit (+) |
| US government sends aid to Ukraine | Transfer | Current Account | Debit (-) |
| Chinese investor buys US Treasury Bonds | Asset Purchase | Financial Account | Credit (+) (Capital Inflow) |
| US company builds a factory in Mexico | FDI | Financial Account | Debit (-) (Capital Outflow) |

The Relationship Between Accounts
If a country has a Current Account Deficit (imports > exports), it must finance that deficit. How? By having a Financial Account Surplus (net capital inflow). Effectively, if you spend more than you earn, you must borrow or sell assets to make up the difference.
Exchange Rates
An Exchange Rate is simply the price of one currency in terms of another. In a floating exchange rate system, this price is determined by the market forces of supply and demand.
Definitions
- Appreciation: An increase in the value of a currency relative to another. One unit of currency buys more units of foreign currency.
- Depreciation: A decrease in the value of a currency relative to another. One unit of currency buys fewer units of foreign currency.
The Math of Exchange Rates
Currencies are reciprocals. If Currency A appreciates relative to Currency B, Currency B must depreciate relative to Currency A.
Example:
If the exchange rate changes from $1USD = 100JPY$ to $1USD = 120JPY$:
- The USD has appreciated (it buys more Yen).
- The JPY has depreciated (it now costs 120 Yen to buy a dollar, up from 100).
The Foreign Exchange Market (Forex)
To analyze exchange rates, we use the Foreign Exchange Market graph. This is the most critical graph in Unit 6.
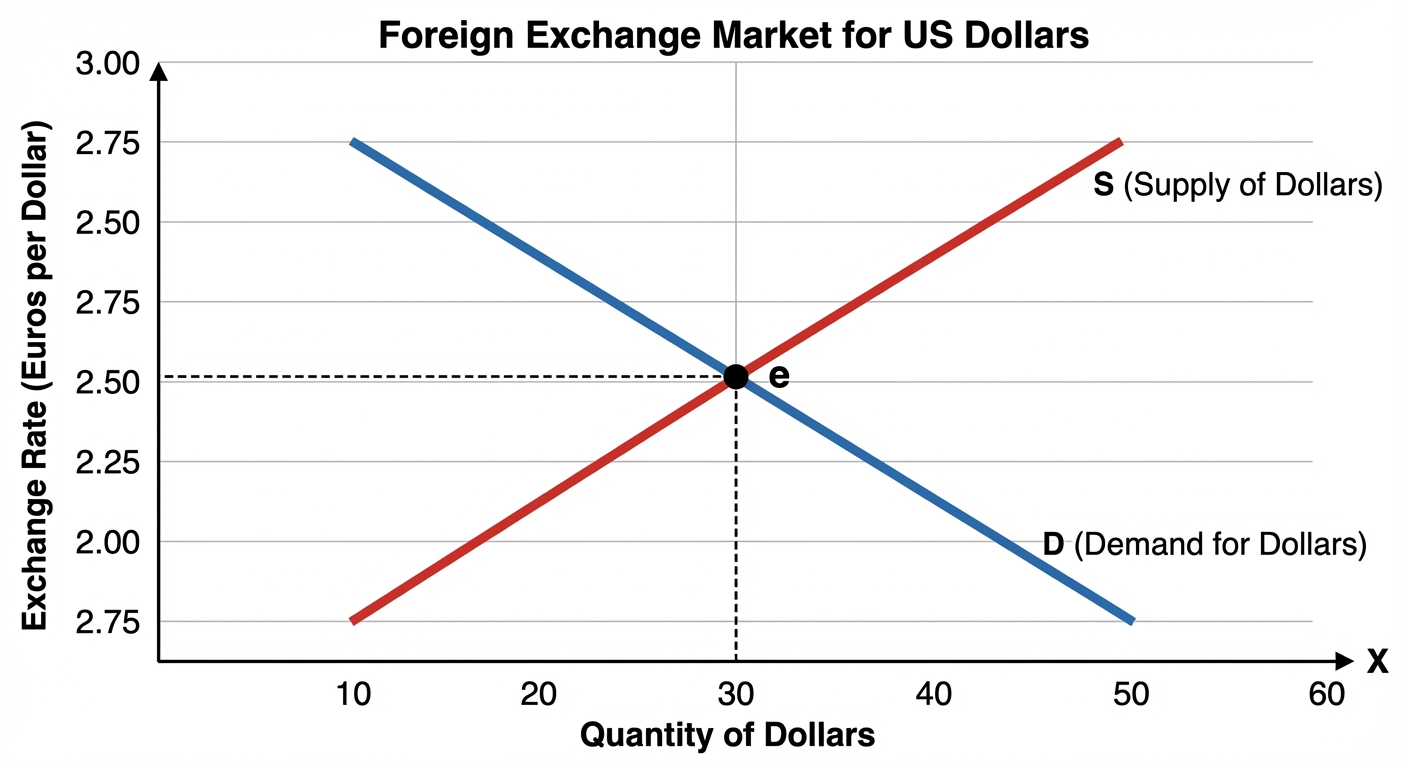
Anatomy of the Graph
- Vertical Axis: The Exchange Rate (e.g., Euros per Dollar or $\text{€}/\$$).
- Horizontal Axis: Quantity of the currency (e.g., Quantity of Dollars).
- Demand Curve (Downward Sloping): Represents foreigners who want to buy Dollars to buy US goods or assets. As the Dollar depreciates (gets cheaper), US goods become cheaper for Europeans, so they demand more Dollars.
- Supply Curve (Upward Sloping): Represents US citizens selling Dollars to buy Euros (to buy European goods). As the Dollar appreciates, European goods become cheaper for Americans, so they supply more Dollars to the market to buy Euros.
Determinants: What Shifts the Curves?
There are four major "shifters" that change the demand and supply for currency. Remember the acronym T.I.P.S.
1. Tastes and Preferences
If consumers prefer goods from a specific country, demand for that country's currency increases.
- Scenario: British tourists flock to Disney World (US).
- Effect: Demand for USD increases (shifts right). USD Appreciates.
2. Income (Relative Income Levels)
Crucial Logic: Usually, when a country's GDP/Income rises, their currency depreciates.
- Why? If US income rises, Americans have more disposable money. They buy more domestic goods AND more imports. To buy imports, they must sell USD to buy foreign currency.
- Graph Shift: Supply of USD increases (shifts right). USD Depreciates.
3. Price Level (Relative Inflation)
If Country A has high inflation compared to Country B, Country A's goods are expensive.
- Demand Side: Foreigners want fewer of Country A's goods. Demand for Currency A decreases.
- Supply Side: Citizens of Country A find foreign goods cheaper. Supply of Currency A increases.
- Result: Currency A Depreciates.
4. Speculation (Relative Interest Rates)
This is the most frequently tested shifter. Financial capital flows to the country with the highest real interest rate (highest Return on Investment).
- Scenario: The Federal Reserve raises US interest rates, while the European Central Bank keeps rates low.
- Investment Logic: European investors want to buy US Bonds to get the higher interest payment.
- Forex Impact: To buy US bonds, Europeans must exchange Euros for Dollars. Demand for USD increases.
- Result: The USD Appreciates.

Net Exports Connection
Changes in the exchange rate feed back into the economy (Aggregate Demand):
- If Currency Appreciates: Exports become expensive; Imports become cheap. Net Exports ($X-M$) decrease.
- If Currency Depreciates: Exports become cheap; Imports become expensive. Net Exports ($X-M$) increase.
Common Mistakes & Pitfalls
Confusing "Capital" definitions:
- In Unit 2 (GDP), "Investment" or "Capital" refers to physical tools and machinery.
- In Unit 6 (BoP), the "Financial/Capital Account" refers to financial assets (money, stocks, bonds).
The Income Trap:
- Students often assume that if a country is rich (High Income), its currency gets stronger.
- Correction: In the short run Forex model, higher income means more spending on imports $\rightarrow$ higher Supply of currency $\rightarrow$ Depreciation.
Double Shifting:
- On the AP exam, usually only shift one curve unless specified. For example, if Interest Rates rise, technically Demand for currency increases AND Supply decreases (domestic investors keep money at home). However, shifting just the Demand curve acts as the primary driver and makes the graph clearer.
Labeling Axes Incorrectly:
- If you are graphing the Market for Dollars, the Y-axis must be "Foreign Currency / Dollar". Do not just write "Price". You must specify the ratio (e.g., Yen/Dollar).