Mastering AP Statistics Unit 3: Experimental Design
Observational Studies vs. Experiments
To conduct statistical analysis, we must first gather clear, reliable data. The method used to collect data determines the type of conclusions we can draw.
Definitions and Core Differences
There is a fundamental bridge you must cross in AP Statistics: the difference between observing the world and influencing it.
Observational Study: The researcher observes individuals and measures variables of interest but does not attempt to influence the responses. No treatment is imposed.
- Goal: To describe groups or examine relationships.
- Limitation: Cannot demonstrate causation; can only show association or correlation.
Experiment: The researcher deliberately imposes some treatment on individuals to measure their responses.
- Goal: To determine if a treatment causes a change in the response.
- Key Feature: When designed correctly (random assignment), experiments are the only way to show cause and effect.
Key Vocabulary
- Experimental Units: The smallest collection of individuals to which treatments are applied (e.g., humans, rats, petri dishes). If humans, they are often called subjects.
- Explanatory Variable (Factor): The variable being manipulated to predict changes in the response variable.
- Levels: The specific values that the experimenter chooses for a factor.
- Treatments: The specific condition applied to the individuals. If an experiment has one factor, the treatments are the levels. If it has multiple factors, the treatments are the combinations of levels.
Example: The Tomato Plant Experiment
You want to test how fertilizer type (A vs. B) and sunlight (Full vs. Shade) affect tomato weight.
- Explanatory Variables (Factors): 2 (Fertilizer, Sunlight)
- Levels: Fertilizer has 2 levels; Sunlight has 2 levels.
- Treatments: $2 \times 2 = 4$ distinct treatments (A/Full, A/Shade, B/Full, B/Shade).
- Response Variable: Weight of the tomato.
Principles of Experimental Design
To minimize bias and variability, a valid experiment must rely on three fundamental principles. A useful mnemonic is Control, Randomize, Replicate.
1. Control
Control refers to keeping other variables constant for all experimental units.
- Its purpose is to prevent lurking variables from becoming confounding variables.
- Control Group: A group that receives an inactive treatment (placebo), an existing baseline treatment, or no treatment at all. It provides a baseline for comparison.
2. Randomization
Random assignment implies that experimental units are assigned to treatments using a chance process (e.g., coin flip, RNG, hat draw).
- Purpose: To create groups that are roughly equivalent at the start of the experiment by balancing the effects of uncontrolled variables (both known and unknown).
- Key Distinction: Random sampling allows generalization to the population. Random assignment allows causal inference.
3. Replication
Replication means using enough experimental units in each treatment group.
- Purpose: To see the variability of the response clearly and distinguish the treatment effect from chance variation.
- Note: In AP Stats, replication usually refers to sample size ($n$), not necessarily repeating the entire experiment from scratch (though that is also scientifically important).
Types of Experimental Designs
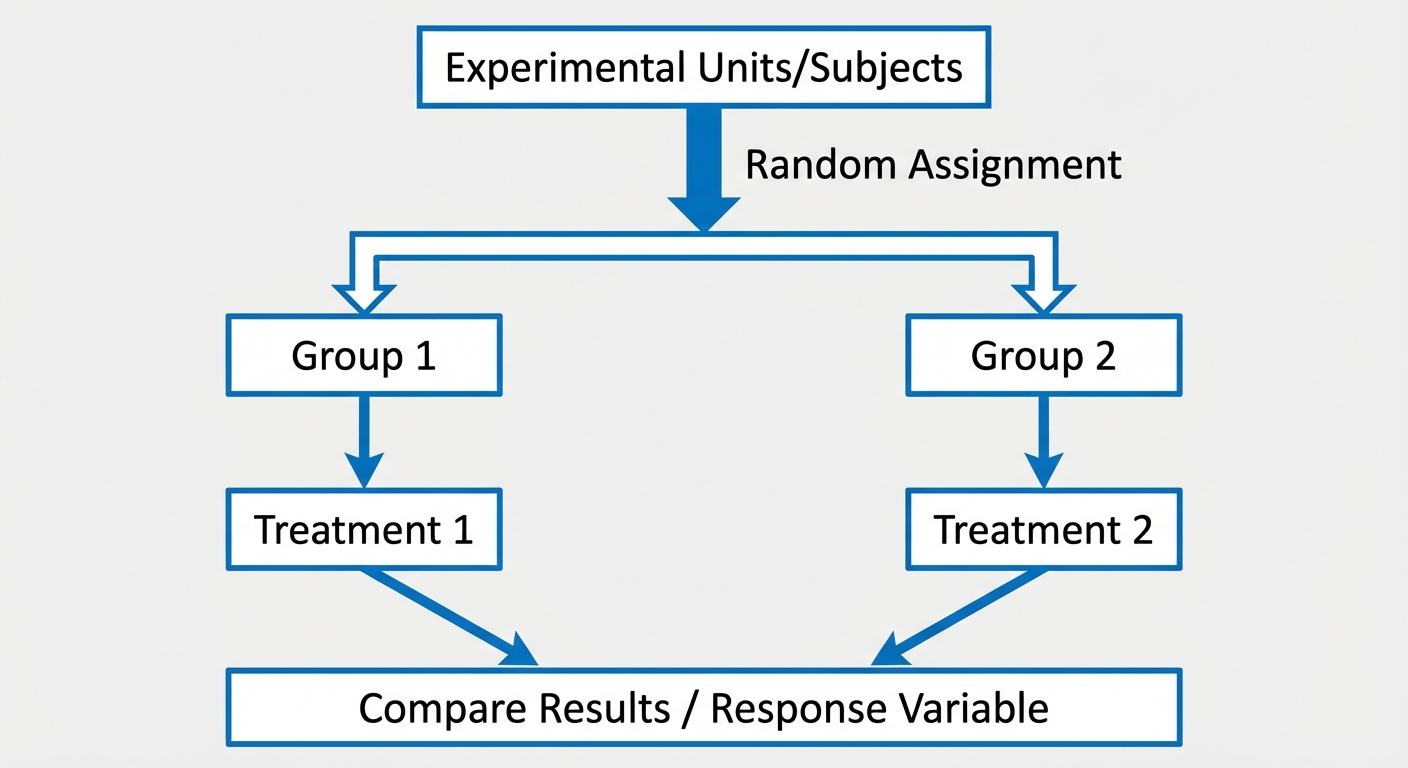
Completely Randomized Design
This is the simplest valid design. All experimental units are allocated at random among all specific treatments.
- Process:
- Start with $n$ subjects.
- Use a random mechanism to split them into Group A and Group B.
- Apply Treatment 1 to Group A and Treatment 2 to Group B.
- Compare the response variable.
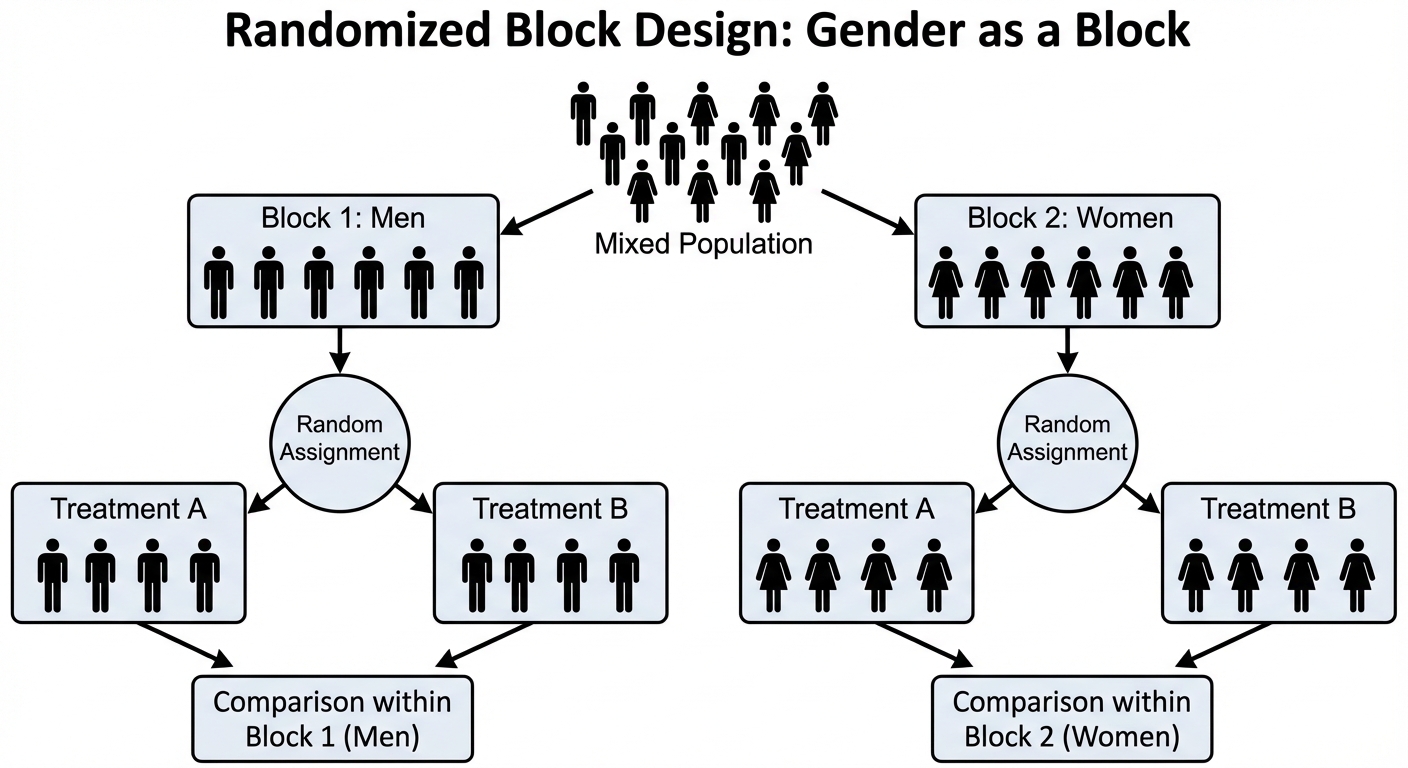
Randomized Block Design
Blocking is used to reduce variability. A block is a group of experimental units that are known to be similar in some way that is expected to affect the response to the treatments.
- The Golden Rule of Blocking: Block what you can, randomize what you cannot.
- Process: Use a blocking variable (e.g., gender, breed of dog, size of farm) to separate units into blocks first. Then, randomly assign treatments within each individual block.
- Analogy: Blocking in an experiment is similar to stratifying in sampling.
Matched Pairs Design
A special case of randomized block design used for comparing two treatments. There are two standard ways to do this:
- One Subject: Each unit receives both treatments in a random order. The individual serves as their own control (e.g., a taste test where one person drinks Coke, waits, then drinks Pepsi; the order is randomized).
- Two Subjects: Subjects are paired based on similarity (e.g., twins, or two people of same age/weight). One is randomly assigned Treatment A, the other Treatment B.
Critical Concepts: Blinding and The Placebo Effect
The Placebo Effect
This occurs when a subject exhibits a response to a "dummy" treatment simply because they believe they are being treated.
- To measure the true effect of a new drug, the experimental group must show improvement significantly greater than the placebo group.
Blinding
Bias arises if subjects or researchers know which treatment is being administered (e.g., a doctor might subconsciously interpret recovery signs better for the new drug group).
- Single-blind: The subjects do not know which treatment they are receiving, but the people interacting with them do.
- Double-blind: Neither the subjects nor those who interact with them and measure the response variable know which treatment a subject received. This is the gold standard used to reduce bias.
Confounding Variables and Inference from Experiments
Confounding Variables
A confounding variable is an outside variable that is related to the explanatory variable and influences the response variable, making it impossible to determine which variable is causing the change.
- Example: A study compares student test scores (Response) between Class A (uses tablets) and Class B (uses textbooks). If Class A meets at 9:00 AM and Class B meets at 1:00 PM (after lunch), "Time of Day" is a confounding variable. We don't know if the higher scores are due to the tablets or the morning energy.
Scope of Inference
Determining what conclusions you can draw depends on the design used. This is often represented as a $2 \times 2$ grid on the AP Exam.
| Random Assignment | No Random Assignment | |
|---|---|---|
| Random Selection | Inference about Population: YES Inference about Cause/Effect: YES | Inference about Population: YES Inference about Cause/Effect: NO |
| No Random Selection | Inference about Population: NO Inference about Cause/Effect: YES | Inference about Population: NO Inference about Cause/Effect: NO |
- Random Selection connects the sample to the population.
- Random Assignment connects the treatment to the result (Causation).
Common Mistakes & Pitfalls
Confusing Random Sampling with Random Assignment
- Mistake: "We used random assignment so we can generalize to the whole population."
- Correction: No! Random assignment balances groups for experiments (Causation). Random sampling creates representative groups (Generalization).
Misunderstanding Blocking
- Mistake: Thinking blocking creates random samples.
- Correction: Blocking filters out a specific source of variation (nuisance variable) to make the treatment effect clearer. It is not random; it is deliberate sorting.
Vague Descriptions of Randomization
- Mistake: "I will randomly assign them."
- Correction: You must be specific! "I will label the 50 subjects 01-50, use a random number generator to select 25 unique numbers, and assign those subjects to Group A. The remaining 25 go to Group B."
Confounding vs. Bias
- Mistake: Using the terms interchangeably.
- Correction: Bias is a systematic error favoring a specific outcome. Confounding means the effects of two variables is mixed up. Confounding can lead to bias, but they are defined differently.