AP Physics 2: Thermodynamic Cycles, Probability, and Entropy
Understanding Pressure-Volume (PV) Diagrams
Thermodynamics in AP Physics 2 revolves around understanding how energy moves within a system, specifically an ideal gas. The primary tool for visualizing these changes is the PV Diagram (Pressure vs. Volume graph), and the governing rule is the First Law of Thermodynamics.
The First Law of Thermodynamics
This law is essentially the conservation of energy applied to thermal systems. It states that the change in the internal energy of a system is equal to the heat added to the system plus the work done on the system.
| Variable | Name | Definition | Sign Convention (AP Physics 2) |
|---|---|---|---|
| $\Delta U$ | Change in Internal Energy | The energy stored in the motion of the gas particles. Directly proportional to Temperature ($T$). | $(+)$ if $T$ increases $(-)$ if $T$ decreases |
| $Q$ | Heat | Energy transferred due to temperature difference. | $(+)$ if heat is added to system $(-)$ if heat is removed from system |
| $W$ | Work | Energy transferred by mechanical force (compression/expansion). | $(+)$ if work done ON gas (Compression) $(-)$ if work done BY gas (Expansion) |
Note on Notation: The AP Physics 2 equation sheet defines work as $W = -P\Delta V$. Because an expansion means $\Delta V$ is positive, the work done on the system is negative (energy leaves the gas to push the piston). Always check if the question asks for work done on the gas or by the gas.
Analyzing PV Diagrams
A PV diagram maps the state of a gas. The P-axis represents Pressure, and the V-axis represents Volume.
- State Variables: Any point $(V, P)$ represents a specific state. Using the Ideal Gas Law ($PV = nRT$), implies that every point also corresponds to a specific Temperature ($T$). Points further from the origin (up and right) generally represent higher temperatures (isotherms).
- Work as Area: The absolute value of the work done during a process corresponds to the geometric area under the curve (between the process line and the horizontal volume axis).
- Expansion (Moving Right): Area is work done by the gas. $\Delta V > 0$, so $W < 0$.
- Compression (Moving Left): Area is work done on the gas. $\Delta V < 0$, so $W > 0$.
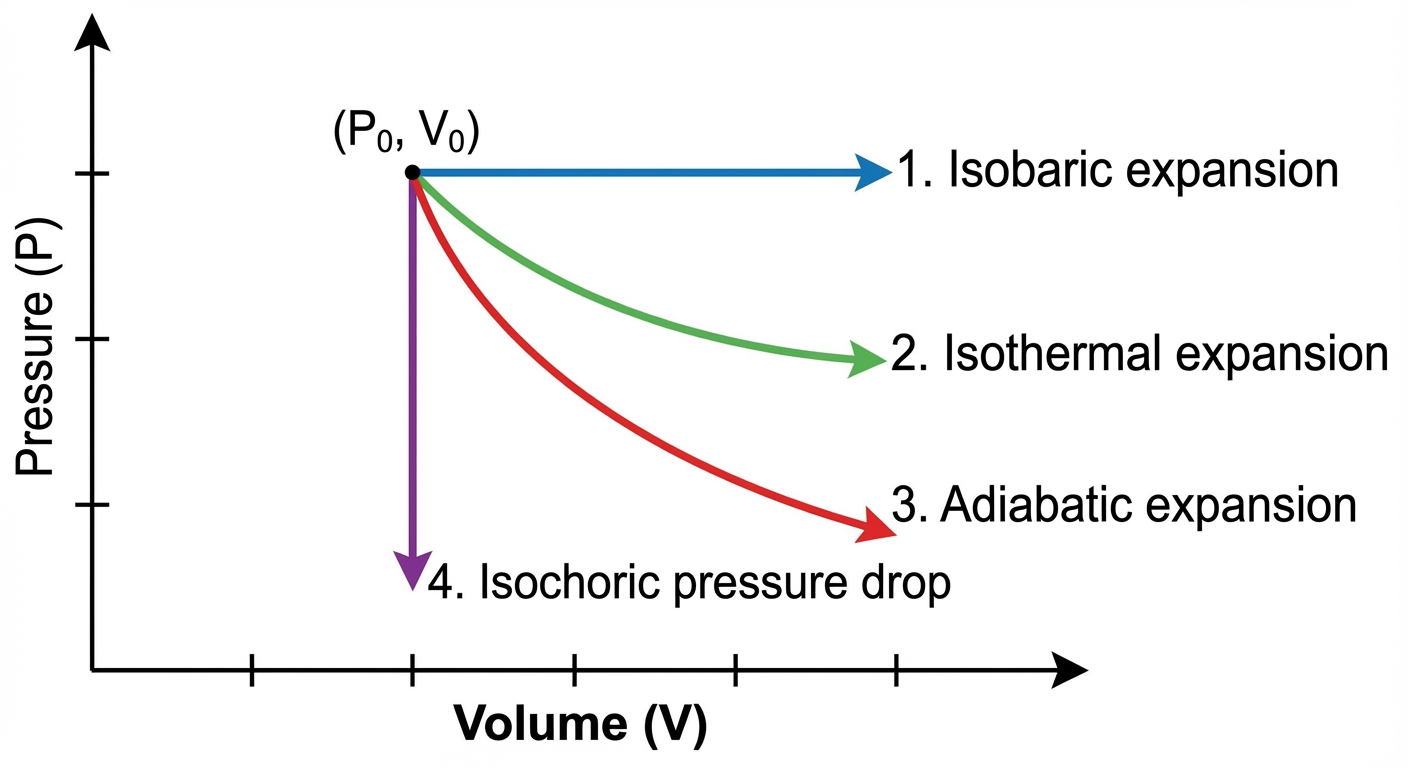
Four Key Thermodynamic Processes
You must be able to identify these four specific processes on a graph and calculate the variables for each.
1. Isobaric Process (Constant Pressure)
- Graph: A horizontal line.
- Concept: The gas expands or contracts while maintaining constant pressure (e.g., a piston moving freely).
- Math:
- $W = -P\Delta V = -P(Vf - Vi)$
- Both $Q$ and $\Delta U$ change.
2. Isochoric / Isovolumetric Process (Constant Volume)
- Graph: A vertical line.
- Concept: The gas is in a rigid container. No moving walls.
- Math:
- $\Delta V = 0$
- Work ($W$) = 0 (No area under a vertical line).
- Therefore, $\Delta U = Q$. Calculate $Q$ directly if $\Delta U$ is known.
3. Isothermal Process (Constant Temperature)
- Graph: A curved line shaped like a hyperbola ($P \propto 1/V$). It follows an "isotherm."
- Concept: The system is in contact with a thermal reservoir that keeps $T$ constant explicitly. Heat flows in/out to maintain $T$ during expansion/compression.
- Math:
- $\Delta T = 0$, therefore $\Delta U = 0$ (for an ideal gas).
- First Law becomes: $0 = Q + W$, or $Q = -W$.
- All work done on the gas must leave as heat (and vice versa).
4. Adiabatic Process (No Heat Transfer)
- Graph: A curved line, but steeper than the isothermal curve.
- Concept: The process happens so fast that heat has no time to flow, or the system is perfectly insulated.
- Math:
- $Q = 0$.
- First Law becomes: $\Delta U = W$.
- Expansion: Gas does work ($W < 0$), so internal energy drops ($\Delta U < 0$), and temperature decreases.
- Compression: Work is done on gas ($W > 0$), so internal energy rises ($\Delta U > 0$), and temperature increases.
Thermodynamic Cycles (Heat Engines)
A cycle is a series of processes that returns the gas to its initial state $(Pi, Vi)$.
- Since $T$ returns to the start, $\Delta U_{cycle} = 0$.
- Therefore, the net Work done equals the net Heat exchanged: $W{net} = -Q{net}$.
- Visualizing Net Work: The net work is the area enclosed inside the loop on the PV diagram.
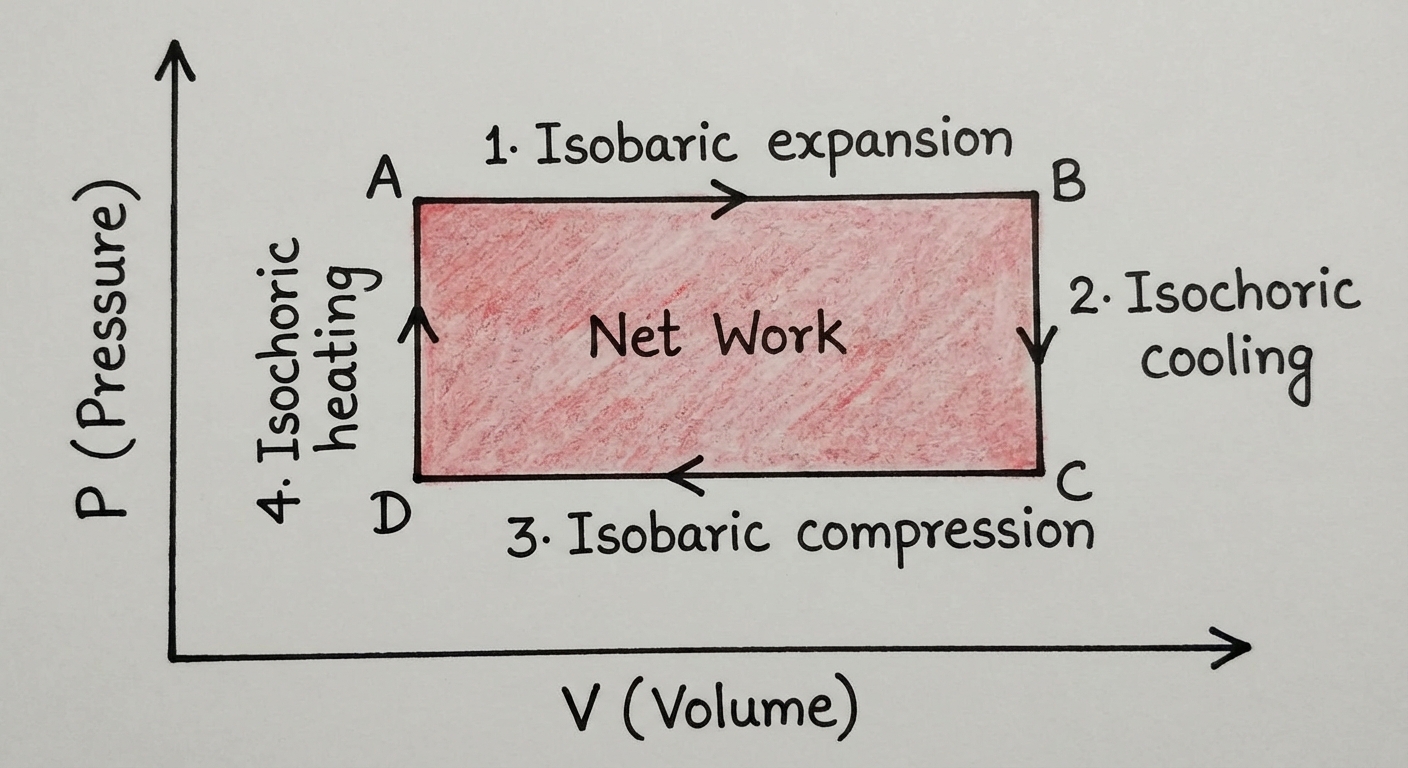
- Clockwise Cycle (Heat Engine): Gas expands at high pressure and compresses at low pressure. Net work is done by the gas (negative work on system). Used to generate power.
- Counter-Clockwise Cycle (Refrigerator/Heat Pump): Net work is done on the gas. Used to move heat from cold to hot.
Probability, Thermal Energy, and Entropy
While the First Law tracks energy quantity, the Second Law of Thermodynamics dictates the direction of energy flow and nature's preference for disorder.
Entropy and the Second Law
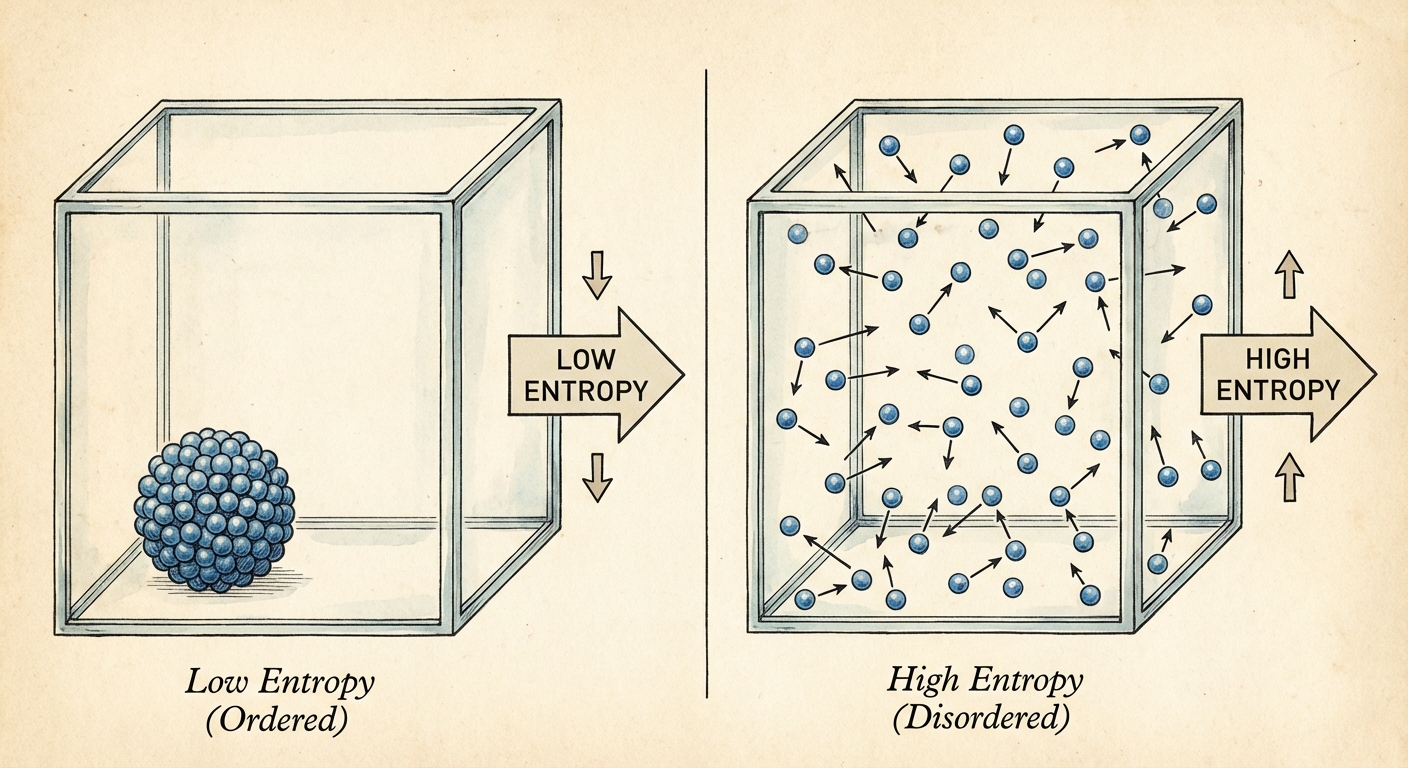
Entropy ($S$) is a measure of the disorder or randomness of a system. More technically, it quantifies the number of ways a system can be arranged microscopically while looking the same macroscopically.
The Second Law states:
In any isolated system, the total entropy always increases or remains constant over time. It never decreases spontaneously.
This explains why:
- Heat flows from hot to cold (never cold to hot).
- Gas molecules spread out to fill a room (never clump into a corner spontaneously).
- Broken eggs do not reassemble.
Microstates vs. Macrostates
To understand why entropy increases, we look at probability.
- Macrostate: The overall description of the system (e.g., Pressure, Volume, Temperature).
- Microstate: The specific position and velocity of every single particle in the gas.
Consider a box with a divider. If you remove the divider, the gas spreads out. Why?
- Ordered State (Low Entropy): All particles on the left side. Statistically, there are very few microstate combinations that result in "all particles on left."
- Disordered State (High Entropy): Particles spread anywhere. There are vastly more microstate combinations where particles are scattered randomly than where they are sorted.
Because the scattered state has exponentially more potential microstates, it is statistically the "most probable" state. Nature moves toward the state of highest probability.
Heat and Entropy
Mathematically, the change in entropy when heat is transferred at a constant temperature is:
- Adding heat ($Q > 0$) increases disorder ($↑$ KE, $↑$ randomness).
- Removing heat ($Q < 0$) decreases disorder locally.
However, for the universe as a whole (System + Surroundings), $\Delta S_{total} \ge 0$.
Summary Comparison Table
| Process | Constant Var | $\Delta U$ | $Q$ | $W$ (Work on gas) |
|---|---|---|---|---|
| Isobaric | pressure ($P$) | $\ne 0$ | $\ne 0$ | $-P\Delta V$ |
| Isochoric | volume ($V$) | $= Q$ | $= \Delta U$ | $0$ |
| Isothermal | temp ($T$) | $0$ | $-W$ | Area under curve |
| Adiabatic | heat ($Q$) | $= W$ | $0$ | Area under curve |
Common Mistakes & Pitfalls
Confusing Signs of Work:
- Mistake: Thinking expansion means positive work.
- Correction: In AP Physics 2, $W$ is work done ON the gas. Expansion pushes outwards, losing energy. $W$ is negative.
Adiabatic means Cold?
- Mistake: Assuming constant heat ($Q=0$) means constant temperature.
- Correction: Adiabatic processes have massive temperature changes because the work done changes the internal energy directly. (e.g., Rapid compression of a diesel engine cylinder ignites fuel because the gas gets so hot, even though no heat was added).
Path Independence Errors:
- Mistake: Thinking Work ($W$) and Heat ($Q$) are state functions.
- Correction: Only Internal Energy ($U$), Pressure, Volume, and Temperature are state functions (depend only on the point on the graph). $W$ and $Q$ depend on the path taken to get there (the area under the specific curve).
Cycle Area:
- Mistake: Calculating area to the x-axis for a full cycle.
- Correction: For a cycle, the net work is only the area enclosed by the loop. (Top curve area minus bottom curve area).