AP Human Geography Unit 2: Population Dynamics and Composition
Patterns of Population Distribution
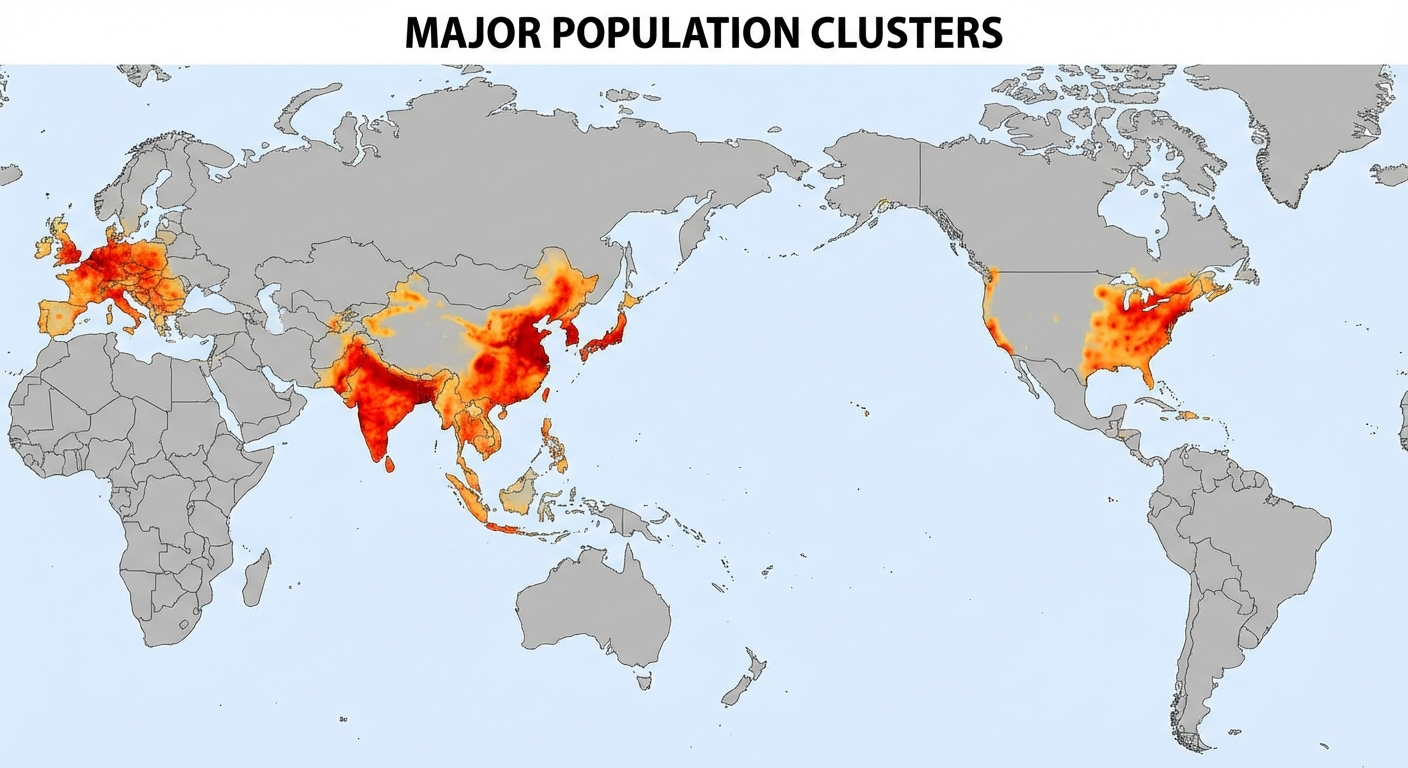
Population Distribution refers to the pattern of where people live. World population is essentially a study of concentration; people are not spread evenly across the Earth's surface. Instead, they are clustered in specific regions based on physical and human factors.
The Concept of Ecumene
The term ecumene refers to the portion of Earth’s surface occupied by permanent human settlement. Over time, the ecumene has expanded as technology allows humans to adapt to harsher environments, but most people still live in specific bands.
Physical Factors Influencing Distribution
Humans generally avoid the "Too Extremes" (Too hot, cold, wet, dry, or high). Instead, populations cluster around:
- Mid-Latitudes: Between 30°N and 60°N, where climates are moderate.
- Low-Lying Areas: Better for soil fertility and ocean access.
- Fresh Water: Rivers and lakes provide drinking water, irrigation, and transportation.
Human Factors Influencing Distribution
- Economic: People move to areas with industrial clusters, job opportunities, and trade routes.
- Political: Stable governments and safety attract population; war zones repel it.
- Cultural: People often cluster near religious sites or within ethnic communities.
Measuring Population Density
To analyze distribution, geographers use three distinct metrics. It is crucial to distinguish between them as they reveal different information about a country's development.
Arithmetic Density
- Definition: The total number of people divided by the total land area.
- Formula:
- Significance: This is a crude average. It tells you "how crowded" a country is generally but hides internal variations (e.g., Egypt has a moderate arithmetic density, but 98% of people live on 3% of the land).
Physiological Density
- Definition: The number of people per unit of arable land (land suitable for growing crops).
- Formula:
- Significance: Indicates the pressure a population places on the land to produce food. A high physiological density suggests a struggle to feed the population (e.g., Egypt or Japan).
Agricultural Density
- Definition: The ratio of the number of farmers to the total amount of arable land.
- Formula:
- Significance: This is a proxy for development and technology.
- Low Agricultural Density = MDCs (More Developed Countries). They use machines, so fewer farmers are needed to work the land.
- High Agricultural Density = LDCs (Less Developed Countries). They rely on manual labor, requiring more farmers per field.
| Density Type | Numerator | Denominator | What it reveals |
|---|---|---|---|
| Arithmetic | Total People | Total Land | General crowding |
| Physiological | Total People | Arable Land | Food security/pressure |
| Agricultural | Farmers | Arable Land | Economic efficiency/Tech level |
Consequences of Population Distribution
The way a population is distributed has massive implications for political systems, the environment, and social services.
Political, Economic, and Social Implications
- Political Influence: Electoral districts are often drawn based on population figures. Uneven distribution can lead to power imbalances between urban and rural areas.
- Provision of Services: Public services (hospitals, schools, sewers) are cost-effective in clustered urban areas but expensive and difficult to provide in dispersed rural areas.
- Economic Hierarchy: Businesses cluster where customers are. This reinforces urbanization as jobs concentrate in density centers.
Environmental Impact and Carrying Capacity
Carrying Capacity is the maximum population size of a species that the environment can sustain indefinitely, given the available food, habitat, water, and other necessities.
- Overpopulation occurs not just when there are "too many people," but when the population exceeds the carrying capacity.
- High concentration leads to pollution points (e.g., smog in Mexico City) and strain on local aquifers.
Population Composition
While distribution asks "where," population composition asks "who." Geographers analyze the makeup of the population using age, sex, and ethnicity data.
The Population Pyramid (Age-Sex Structure)
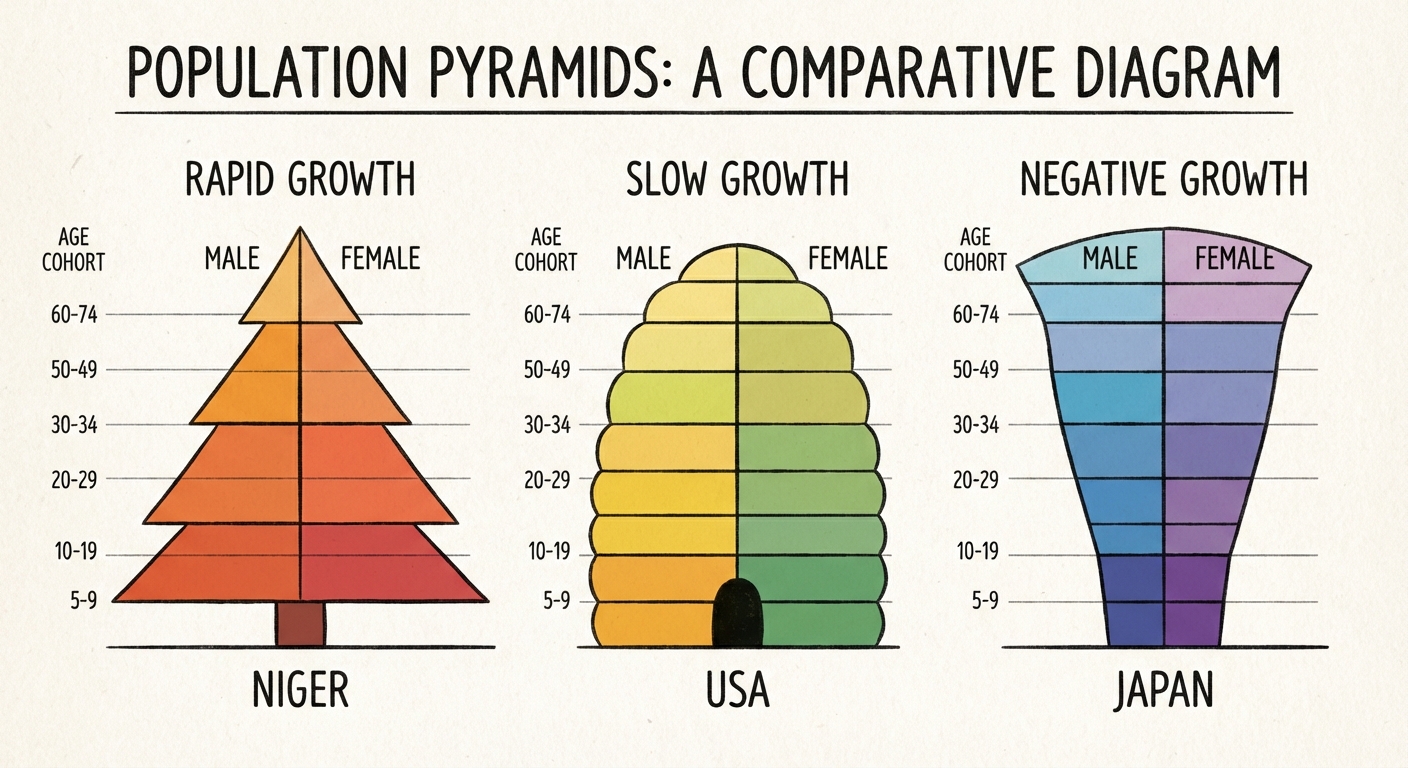
The primary tool for visualizing composition is the Population Pyramid. This is a bar graph displayed horizontally:
- X-axis: Males on the left, Females on the right.
- Y-axis: Age cohorts (usually 5-year groups), young at the bottom, old at the top.
Interpreting Pyramid Shapes
The shape of the pyramid tells the story of a country's development (Demographic Transition Model or DTM).
Wide Base / Tapering Top (Triangle)
- Meaning: High Birth Rate, Low Life Expectancy.
- Growth: Rapid Growth.
- Context: Stage 2 LDCs (e.g., Niger, Mali).
Rectangular / Column Shape
- Meaning: Birth rates are falling to meet death rates.
- Growth: Slow or Stable Growth.
- Context: Stage 4 MDCs (e.g., United States, Canada).
Inverted Base (Narrow Bottom)
- Meaning: Birth rate has dropped below replacement level.
- Growth: Negative Growth (Population shrinking).
- Context: Stage 5 countries (e.g., Japan, Germany).
Anomalies in Pyramids
Look for bulges or indents that break the pattern:
- "Missing Men": An indentation on the male side usually indicates a past war.
- "Baby Boom": A bulge in a specific age cohort indicates a period of high birth rates (e.g., post-WWII in the US).
- "Guest Workers": A bulge in working-age males (20–50) suggests an influx of migrant labor (common in Middle Eastern oil states like Qatar).
Key Composition Metrics
- Sex Ratio: The number of males per 100 females. Culturally preference for sons (e.g., China, India) can skew this ratio significantly.
- Dependency Ratio: A measure of the economic strain on the productive population.
- It compares the Dependent Population (Too young to work [0-14] + Too old to work [65+]) to the Potential Workforce (15-64).
- Implication: A high dependency ratio means workers face higher taxes to support schools (Youth Dependency) or pensions/healthcare (Elderly Dependency).
Common Mistakes & Pitfalls
Confusing Density Types: The most common error is thinking high Agricultural Density means "lots of food production."
- Correction: It means inefficient farming. It means there are too many farmers stuck on a plot of land because they lack tractors.
Misreading Pyramids: Students often forget that the X-axis can run in absolute numbers OR percentages.
- Correction: Always check the label. A "small" country might have the exact same shape as a "large" country, even if the total numbers are vastly different.
Assuming Density = Wealth: High arithmetic density does not equal poverty.
- Correction: The Netherlands and Singapore have incredibly high arithmetic densities but are wealthy. Bangladesh has high density and is developing. Look at the type of density and the economy, not just the crowding.
Ecological Fallacy: Assuming that because a country has a certain average (e.g., 2.1 fertility rate), every region in that country is the same.
- Correction: Always acknowledge internal variation (urban vs. rural differences).