Foundations of Geography: Space, Place, and Patterns
Introduction to Thinking Geographically
Unit 1 establishes the fundamental vocabulary and tools geographers use to analyze the world. Geography is not just about where things are, but why they are there and how they relate to other things. It connects the physical world (space) with human meaning (place).
1. Maps and Spatial Representation
Maps are the primary tool for spatial analysis. They are two-dimensional representations of Earth's three-dimensional surface. It is impossible to represent a sphere on a flat plane without distortion.
Types of Maps
Reference Maps: Designed for people to refer to for general information about places.
- Political Maps: Show human-made boundaries (countries, states, cities).
- Physical Maps: Show natural features (mountains, rivers, deserts).
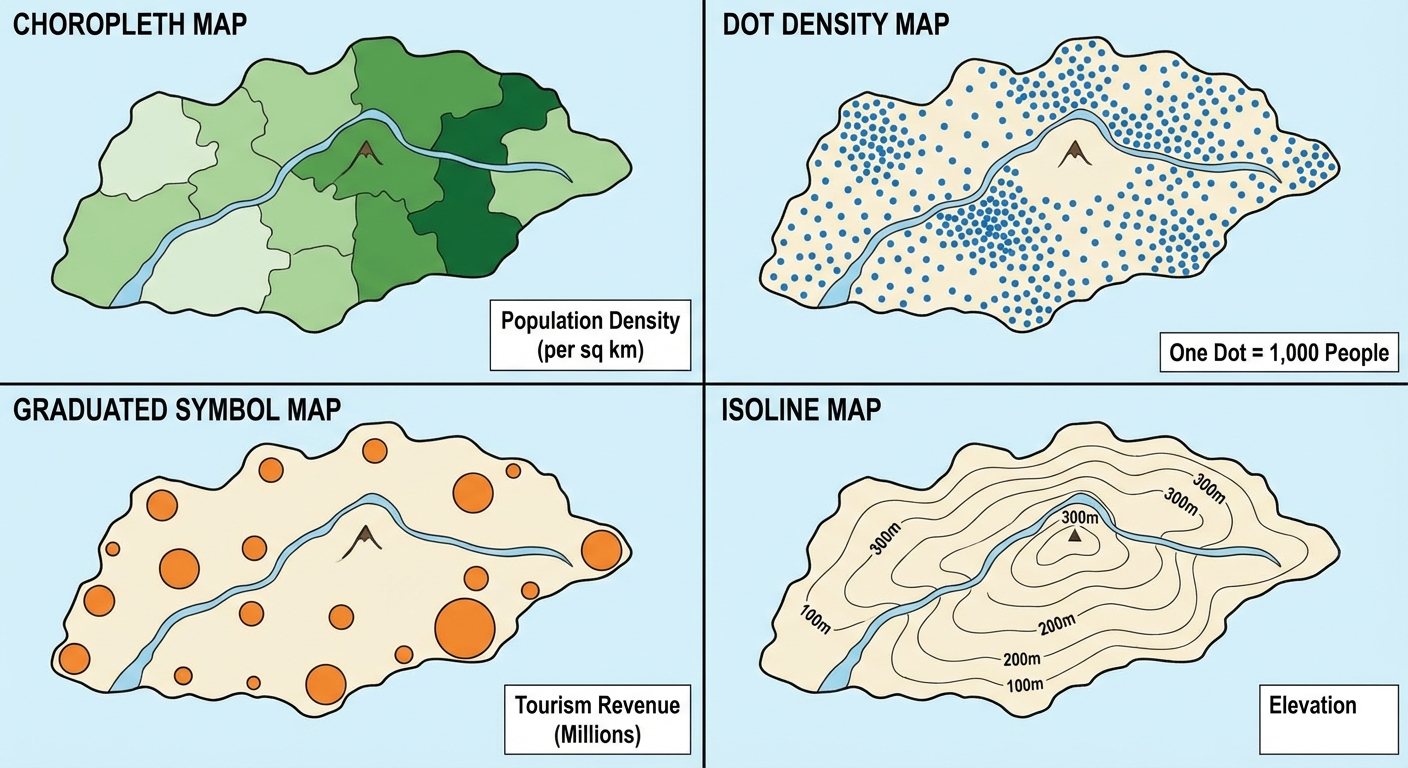
Thematic Maps: Show spatial aspects of information or a specific phenomenon.
- Choropleth Map: Uses various colors or shades of one color to represent data values (e.g., darker blue = higher population density).
- Dot Density Map: Uses dots to represent the volume/density of a feature. Each dot represents a specific quantity (e.g., one dot = 5,000 people).
- Graduated Symbol Map: Uses symbols of different sizes to indicate different amounts of something (e.g., larger circles for larger oil reserves).
- Isoline Map: Connects points of equal value with lines (e.g., topographical maps for elevation, weather maps for temperature).
- Cartogram: Distorts the size of land areas to represent a specific statistical variable (e.g., making China huge and Canada small to represent population).
- Flow-line Map: Uses lines of varying thickness to show the direction and volume of movement (e.g., migration patterns).
Map Projections and Distortion
Every map projection distorts the Earth in some way. Geographers must choose between preserving Shape, Area, Distance, or Direction (S.A.D.D.).
- Mercator Projection: Preserves direction (great for marine navigation). Distortion: drastically distorts size near the poles (Greenland looks the size of Africa; in reality, Africa is 14x larger).
- Peters Projection: An Equal-Area projection. Preserves relative size. Distortion: distorts shape (continents look stretched).
- Robinson/Goode Homolosine: Compromise projections. They try to balance shape and area distortion to create a visually appealing map, but neither is perfectly accurate.
Common Mistakes: Map Types
- Mistake: Confusing Isoline and Topographic maps.
- Correction: A topographic map is a type of isoline map, specifically for elevation. Not all isoline maps are topographic (some are for temperature, air pressure, etc.).
- Mistake: Thinking the Mercator projection is "wrong."
- Correction: It is not wrong; it was built for navigation, not for comparing land sizes.
2. Geographic Data and Technologies
Modern geography relies on geospatial data to make decisions.
Geospatial Technologies
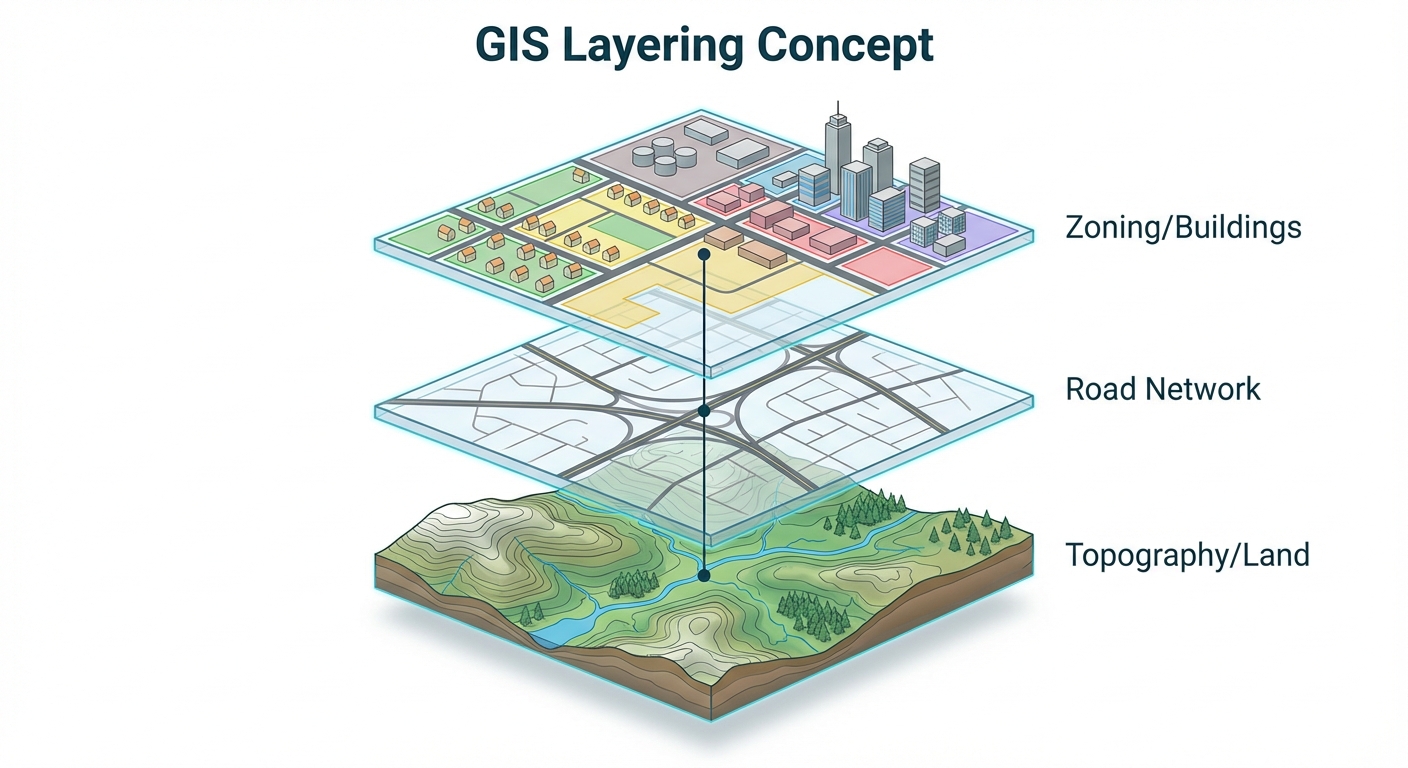
- GIS (Geographic Information Systems): A computer system that captures, stores, analyzes, and displays geographic data. The key feature is layering.
- Example: A city planner layers a map of watersheds, a map of zoning laws, and a map of existing roads to decide where to build a new mall.
- GPS (Global Positioning System): A network of satellites that determines the absolute location (latitude/longitude) of a receiver on Earth.
- Primary Use: Navigation and precise location tracking.
- Remote Sensing: The acquisition of data about Earth's surface from a satellite or aircraft without physical contact.
- Example: Monitoring deforestation in the Amazon or storm tracking.
Fieldwork and Qualitative Data
Not all data is technological. Geographers also use:
- Census Data: Quantitative counts of people (age, sex, ethnicity).
- Interviews & Surveys: Qualitative data about how people feel about a place (sense of place).
- Landscape Analysis: Observing the Cultural Landscape (the visible imprint of human activity on the land).
3. Spatial Concepts: Analyzing Location
Location
- Absolute Location: The exact spot on Earth using a coordinate system.
- Latitude: Distance north/south of the Equator (0°).
- Longitude: Distance east/west of the Prime Meridian (0°, runs through Greenwich, England).
- Note: The International Date Line is roughly 180° longitude.
- Relative Location: Describing where something is in relation to other things.
- Example: "Singapore is located at a strategic choke point between the Indian and Pacific Oceans."
Site vs. Situation
These concepts explain why a settlement grows or fails.
- Site: The physical characteristics of the place itself (climate, soil, water availability, elevation).
- Example: New Orleans has a poor site (below sea level, swampy).
- Situation: The location of a place relative to other places (external connections).
- Example: New Orleans has an excellent situation (mouth of the Mississippi River, gateway to the U.S. interior).
Space and Density
Space is the physical gap between two objects. Density is the frequency with which something occurs in space.
- Arithmetic Density: The total number of people divided by the total land area.
- Physiological Density: The number of people per unit of arable (farmable) land. This is a better measure of a country's carrying capacity.
- Example: Egypt has a low arithmetic density (lots of desert) but a massive physiological density (everyone lives near the Nile).
- Agricultural Density: The number of farmers per unit of arable land. Indicates the level of development/technology.
- Low Ag Density = Developed countries (machines do the work).
- High Ag Density = Developing countries (more human labor needed).
Time-Space Compression and Distance Decay
- Distance Decay (Tobler's First Law of Geography): Everything is related to everything else, but near things are more related than distant things. Interaction decreases as distance increases.
- Friction of Distance: The difficulty or cost associated with traversing that distance.
- Time-Space Compression: Technology (planes, internet) reduces the perceived distance between places, effectively "shrinking" the world and reducing the friction of distance.
4. Human-Environment Interaction
How do humans relate to the natural world? There are two main theories:
- Environmental Determinism: The 19th-century theory (now largely rejected) that the physical environment causes social development and cultural traits.
- Claim: "People in tropical climates are lazy because it's hot; people in cold climates are smarter because they have to work harder to survive."
- Why it's wrong: It ignores human agency and technology (and is often racist).
- Possibilism: The modern theory that the physical environment sets limits on human actions, but people have the ability to adjust to the physical environment and choose a course of action.
- Example: Building ski slopes in Dubai (indoor) or growing crops in arid lands using irrigation.
5. Scales of Analysis
This is the concept students struggle with the most. Do not confuse Map Scale with Scale of Analysis.
Map Scale
The mathematical relationship between map distance and Earth distance.
- Small Scale Map: Shows a large area with little detail (e.g., a world map).
- Large Scale Map: Shows a small area with high detail (e.g., a city attraction map).
Memory Aid: Think of it as a fraction. $1/10,000$ (large scale/town) is a larger number than $1/100,000,000$ (small scale/world).
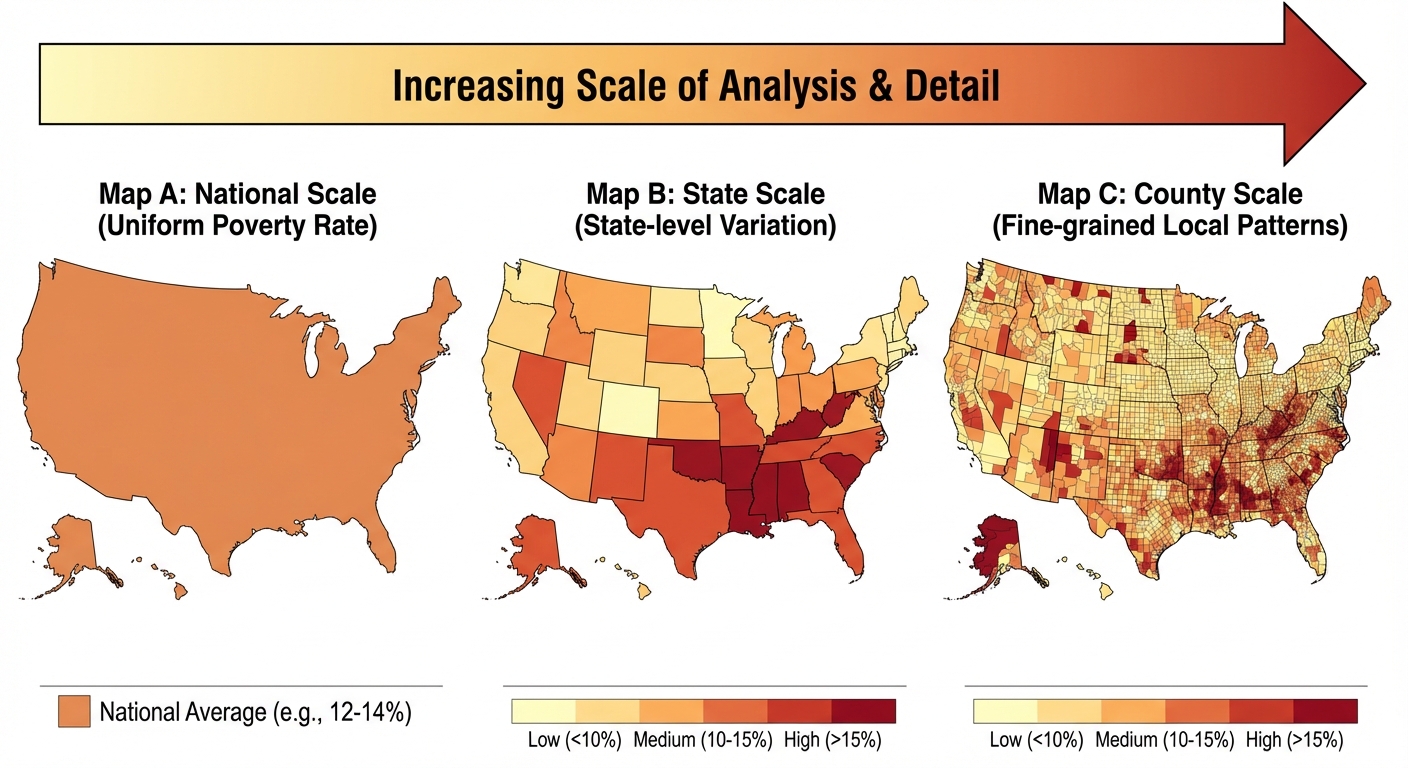
Scale of Analysis (Operational Scale)
How data is aggregated (grouped) to look for patterns.
- Global Scale: Climate change, pandemics.
- National Scale: Federal laws, national languages.
- Regional Scale: The "South," the "Rust Belt."
- Local Scale: City zoning, neighborhood crime rates.
- Crucial Concept: Patterns change at different scales. A state might be wealthy overall (National/Sub-national scale), but contain a very poor city (Local scale).
6. Regions
A region is an area with one or more distinctive characteristics.
1. Formal Region (Uniform)
An area defined by one or more distinctive characteristics that are present throughout the area.
- Boundaries: Usually officially measuring or visible.
- Examples: A state (political), the Corn Belt (agricultural), a French-speaking region (cultural).
2. Functional Region (Nodal)
An area organized around a central node or focal point. The characteristic dominates at the node and diminishes outward (distance decay).
- Examples: The reception area of a TV station, a pizza delivery zone, the commuter zone for a city (people travel to the city).
3. Vernacular Region (Perceptual)
An area that people believe exists as part of their cultural identity. Boundaries are fuzzy and based on opinion.
- Examples: "The South" in the US (Where does it start? Kentucky? Florida?), "The Middle East."
Common Mistakes: Regions
- Mistake: Thinking boundaries are permanent.
- Correction: Boundaries change. The "Rust Belt" (a formal manufacturing region) didn't exist 100 years ago.
- Mistake: Thinking a place can only be in one region.
- Correction: Florida is in a Formal region (USA), a Functional region (trading partners with Latin America), and a Vernacular region (The South? or not?).
7. Spatial Diffusion
Diffusion is the spread of a feature or trend from one place to another over time. The place of origin is the Hearth.
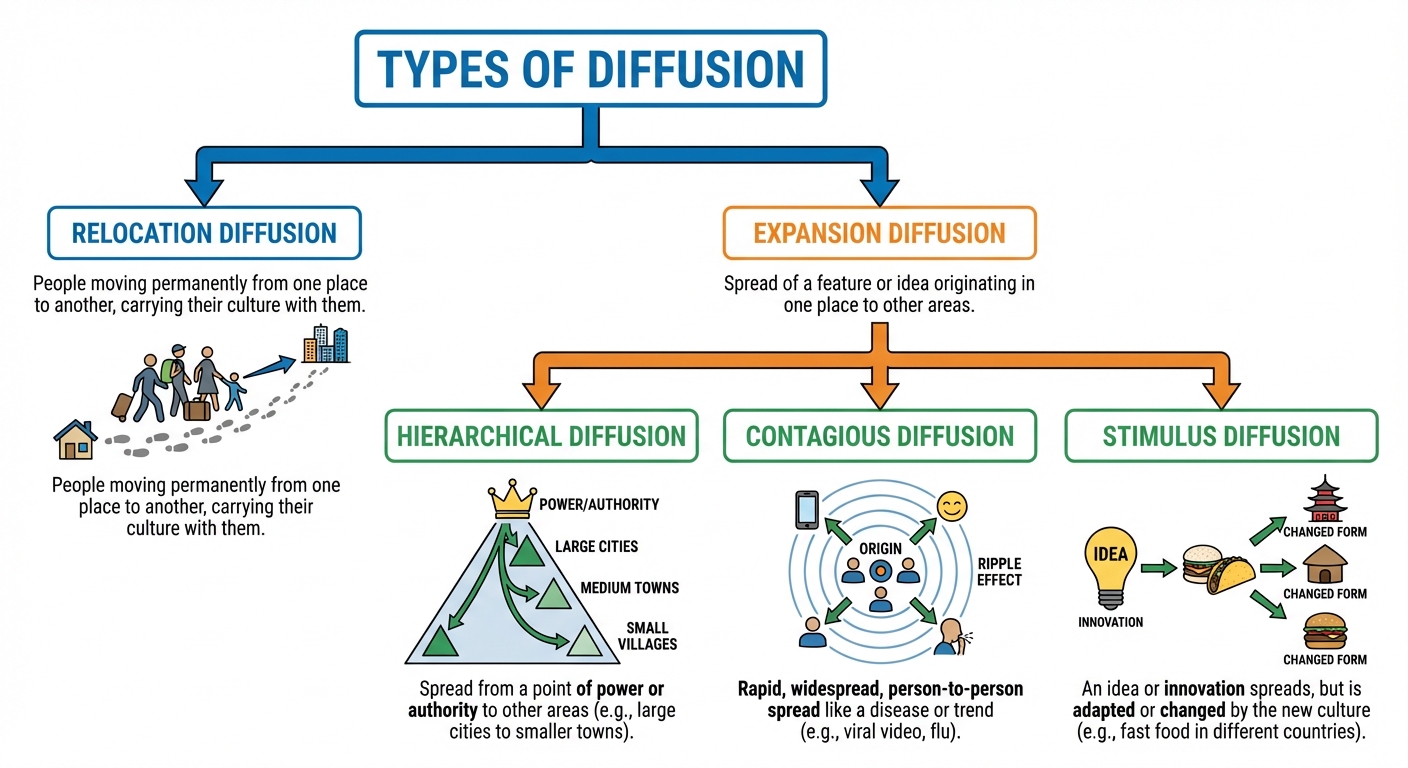
Relocation Diffusion
The spread of an idea through physical movement of people.
- Example: Spanish being spoken in Miami because people migrated from Cuba.
Expansion Diffusion
The spread of a feature in a snowballing process; the amount of people increases.
- Contagious Diffusion: Rapid, widespread diffusion throughout a population without regard for hierarchy. (Like a viral video or a disease).
- Hierarchical Diffusion: Spread from a person/node of authority to other persons/nodes. (Fashion trends start in Paris/NYC $\rightarrow$ Major Cities $\rightarrow$ Small Towns).
- Also: Reverse Hierarchical (Small $\rightarrow$ Big), like Walmart starting in small towns.
- Stimulus Diffusion: The underlying principle spreads, but the specific characteristic is rejected or modified.
- Example: McDonald's in India serves veggie burgers (concept of fast food spreads, but beef is rejected due to culture).
The Gravity Model
A mathematical model used to predict the level of interaction (trade, migration) between two places.
- Translation: Interaction is directly related to the size of the populations (larger cities attract more) and inversely related to the distance (farther away = less interaction).