Measuring Economic Health: National Income and Price Determination
2.1 The Circular Flow and Gross Domestic Product (GDP)
The Circular Flow of Economic Activity
To understand macroeconomics, we must first map how resources, goods, and money move through an economy. The Circular Flow Model visualizes the interdependence of different economic sectors.
Key Sectors and Markets
- Households: Owners of factors of production (land, labor, capital). They sell these factors to firms and buy goods/services.
- Firms: Entities that produce goods and services. They buy factors of production and sell finished products.
- Government: Collects taxes, buys goods/services, and provides transfer payments and public goods.
- Foreign Sector: Represents trade (imports and exports) with other countries.
These sectors interact in two primary markets:
- Product Market: Where goods and services are sold. Households demand; Firms supply.
- Factor (Resource) Market: Where factors of production are sold. Households supply (labor/capital); Firms demand.

Gross Domestic Product (GDP)
GDP is the primary measure of an economy's output. It is defined as the total market value of all final goods and services produced within a country's borders in a specific time period (usually a year).
Three Ways to Calculate GDP
While the College Board focuses heavily on the Expenditure Approach, understanding all three helps verify the concept.
1. The Expenditure Approach (Aggregate Spending)
We add up all spending on final goods and services.
- Consumption ($C$): Spending by households on goods (durables and non-durables) and services. This is the largest component of US GDP (approx. 70%).
- Gross Private Domestic Investment ($I_g$):
- New machinery and equipment bought by businesses.
- New construction (factories and residential housing).
- Change in Inventories (unsold goods produced this year count as investment).
- Note: This does not include financial investment (stocks/bonds) or transfer of existing assets.
- Government Spending ($G$): Spending on goods/services (tanks, schools, bridges).
- Mnemonic: "Government Purchases." Excludes transfer payments (like Social Security) because no production occurs.
- Net Exports ($X_n$ or $X-M$): Exports minus Imports.
- If $Exports > Imports$, trade surplus.
- If $Imports > Exports$, trade deficit.
2. The Income Approach
The sum of all income earned by the factors of production in producing the year's output.
- Wages ($W$): Income from labor.
- Rent ($R$): Income from land/resources.
- Interest ($i$): Income from capital.
- Profit ($P$): Income from entrepreneurship.
3. The Value-Added Approach
Calculated by summing the value added at each stage of production to avoid double counting. Value added = Value of Output - Cost of Intermediate Goods.
What is EXCLUDED from GDP?
To avoid double counting and inaccuracies, the following are ignored:
- Intermediate Goods: Goods used to make other goods (e.g., tires on a new car). Only the final car is counted.
- Used Goods: Second-hand sales (e.g., selling a used car on Craigslist) do not represent new production.
- Financial Transactions: Stocks, bonds, and real estate transfers. These are transfers of ownership, not production.
- Transfer Payments: Government payments like welfare, veterans' benefits, or Social Security. Good/services were not produced in exchange for this money.
- Illegal/Underground Activities: Black market drugs, gambling, or "off the books" labor.
- Non-market Activities: Household work (cooking, cleaning your own home) or volunteer work.
2.2 Limitations of GDP
While GDP is a useful indicator for economic growth ($% \Delta Real GDP$), it is not a perfect measure of societal well-being or standard of living.
The "PIES" Limitations
- P - Population: GDP does not account for population size. A country with high GDP but a massive population may have a low standard of living. Economists use GDP per Capita to solve this.
- I - Inequality: GDP is an aggregate number. It does not show how income is distributed. A country could have high growth where only the top 1% benefit.
- E - Environment: GDP treats the clean-up of a disaster (like an oil spill) as positive spending but does not account for the negative value of pollution or resource depletion.
- S - Shadow Economy: It fails to capture the value of the informal economy (unpaid childcare, barter) or the black market.
Other Limitations
- Quality of Life: Does not measure leisure time, crime rates, or happiness.
- Product Quality: It is difficult to measure improvements in the quality of goods (e.g., a smartphone today vs. 2010).
2.3 Unemployment
Classifying the Population
The Bureau of Labor Statistics (BLS) divides the adult population (16+, civilian, non-institutionalized) into three groups:
- Employed: Worked for pay at least 1 hour.
- Unemployed: Not working, but actively looking for work in the last 4 weeks.
- Not in Labor Force: Not working and not looking (retirees, students, stay-at-home parents, discouraged workers).
Key Formulas
Labor Force ($LF$)
Unemployment Rate ($UR$)
Labor Force Participation Rate ($LFPR$)
Types of Unemployment
There are three main types, often remembered as F.S.C..
1. Frictional Unemployment
- Definition: Temporary unemployment experienced by people changing jobs or entering the labor force.
- Cause: Information gaps; it takes time to find a match.
- Example: A recent college grad looking for their first job; someone quitting to find a better job.
- Status: "Good" unemployment; indicates labor mobility.
2. Structural Unemployment
- Definition: Unemployment caused by a mismatch between workers' skills and the skills needed by employers.
- Cause: Technological change (automation) or globalization (jobs moving overseas).
- Example: A VCR repairman who cannot find work because VCRs are obsolete; a factory worker replaced by a robot.
- Status: "Creative destruction"; painful for workers but often necessary for long-term growth.
3. Cyclical Unemployment
- Definition: Unemployment caused by a recession or invalid demand.
- Cause: A downturn in the business cycle (Deficient Aggregate Demand).
- Example: A waiter laid off because fewer people are dining out during a recession.
- Status: "Bad" unemployment. Policymakers try to eliminate this.
The Natural Rate of Unemployment (NRU)
Full employment does not mean 0% unemployment. It means 0% cyclical unemployment.
- In the US, the NRU is typically around 4-6%.
- Full Employment Output ($Y_f$): The Real GDP produced when the economy is at the NRU.
Common Mistakes: Unemployment
- Mistake: Thinking discouraged workers (gave up looking) are unemployed.
- Correction: They are "Not in Labor Force." When workers become discouraged, the unemployment rate actually drops mathematically because they leave the calculation entirely.
- Mistake: Thinking part-time workers are unemployed.
- Correction: Working 1 hour a week counts as "Employed." This can understate the true economic hardship (underemployment).
2.4 Price Indices and Inflation
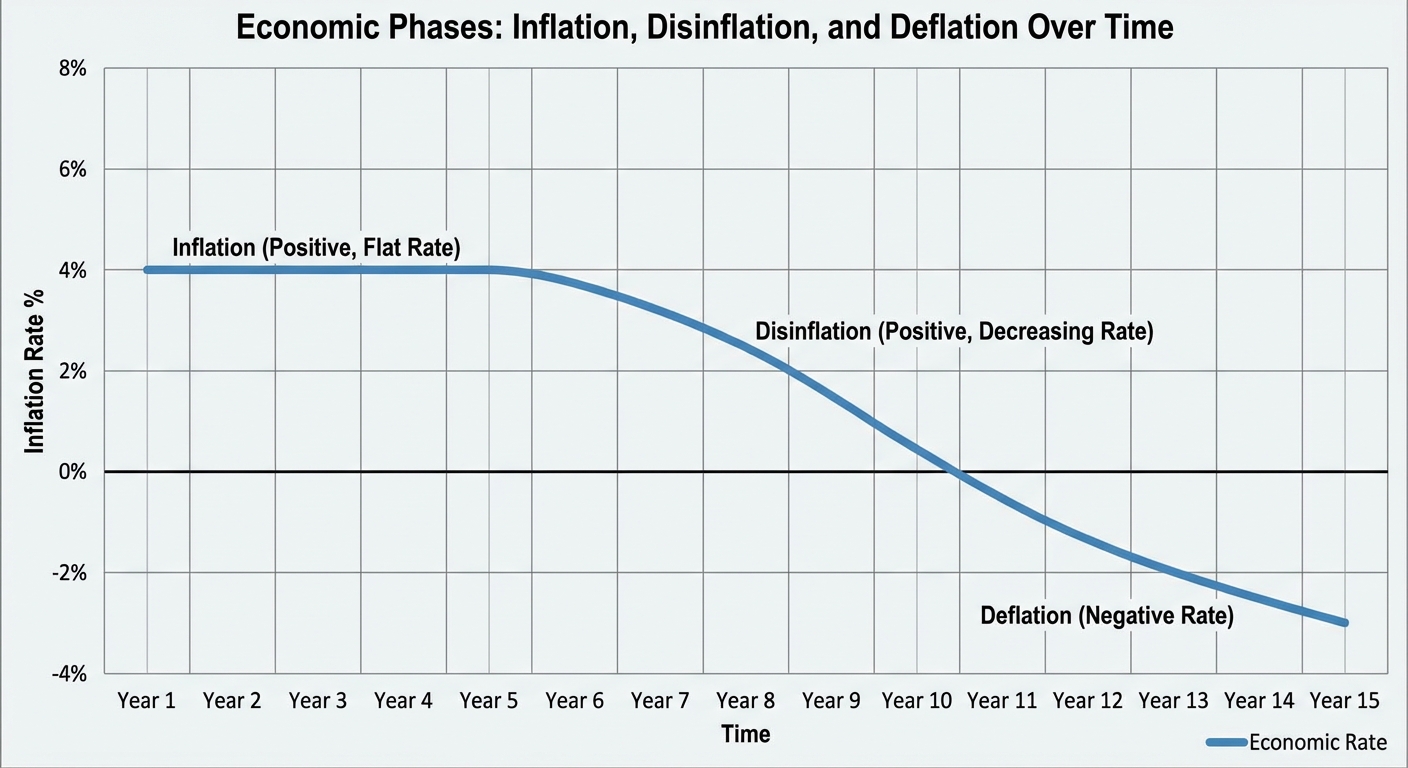
Inflation is a sustained increase in the general price level. Deflation is a decrease in the general price level. Disinflation is a decrease in the rate of inflation (prices are still rising, just slower).
The Consumer Price Index (CPI)
The most common measure of inflation for households. It measures the cost of a fixed "market basket" of goods and services bought by a typical consumer.
Calculating CPI
- Fix the basket (e.g., 20 pizzas, 10 haircuts).
- Find the prices in the current year and the base year.
- Calculate the cost of the basket.
- The Base Year CPI is always 100.
Calculating Inflation Rate
The inflation rate is the percentage change in the price index.
CPI vs. GDP Deflator
Both measure price levels, but with key differences:
- CPI: Includes imports implies only consumer goods. (Measures cost of living).
- GDP Deflator: Includes all domestic production (capital goods, government purchases) but excludes imports. (Measures prices of production).
Problems with CPI
The CPI often overstates inflation due to:
- Substitution Bias: If the price of beef rises, people buy chicken. The fixed basket assumes they still buy beef, exaggerating the cost increase.
- New Products: The basket may not update quickly enough to include new, cheaper tech.
- Quality Bias: A car costs more today than in 1990, but it is also safer and faster. CPI counts the price hike as inflation rather than improved value.
2.5 Costs of Inflation
Not all inflation hurts everyone equally. The impact depends on whether it is Unanticipated (unexpected).
Winners and Losers of Unanticipated Inflation
When inflation is higher than expected, the purchasing power of money falls faster than people planned for.
- Winners:
- Borrowers: They pay back loans with dollars that have less purchasing power (cheaper dollars).
- Firms with fixed-wage worker contracts.
- Losers:
- Lenders (Banks): They get paid back with dollars that buy less.
- Savers: The real value of savings erodes.
- Fixed Income Recipients: Pensioners/Landlords with fixed leases whose income doesn't rise.
Nominal vs. Real Interest Rates
To protect against inflation, lenders add an inflation premium.
Rearranged (The Fisher Equation):
Other Costs
- Shoe-leather Costs: The effort/time spent managing money to avoid holding cash (which loses value).
- Menu Costs: The real costs to businesses of changing listed prices (printing new menus/labels).
- Unit of Account Costs: Inflation makes money a less reliable unit of measurement, confusing long-term planning.
2.6 Real vs. Nominal GDP
Comparing GDP over time requires adjusting for price changes.
- Nominal GDP: Valued at current year prices. (Includes inflation).
- Real GDP: Valued at base year prices. (Adjusted for inflation). Better for measuring growth.
The GDP Deflator Formula
The statistical tool used to convert Nominal to Real.
Alternatively, to find the Deflator:
Working Example
Suppose Nominal GDP rose by 10% and the Price Level rose by 4%.
- $\approx \%\Delta Real \ GDP = \%\Delta Nominal \ GDP - \%\Delta Price \ Level$
- Growth $\approx 10\% - 4\% = 6\%$.
Common Mistakes: Real vs Nominal
- Mistake: Assuming if Nominal GDP increases, output increased.
- Correction: If Nominal GDP goes up 5% and Inflation is 10%, the economy actually shrank in real terms.
- Mistake: Calculating real variables without dividing the index by 100 first (if using decimals) or forgetting the "$\times 100$" (if using whole numbers).
2.7 The Business Cycle
Economies do not grow in a straight line. They fluctuate. This pattern of rising and falling Real GDP is the Business Cycle.
The Four Phases
- Expansion (Recovery): Real GDP is rising. Jobs are being created. Unemployment usually falls. Inflation may rise.
- Peak: The height of the expansion. Real GDP stops rising. Inflation pressure is often high.
- Contraction (Recession): Real GDP is falling. Unemployment rises. Inflation usually falls.
- Technical Definition of Recession: Two consecutive quarters (6 months) of negative Real GDP growth.
- Trough: The bottom of the contraction. Real GDP stops falling.
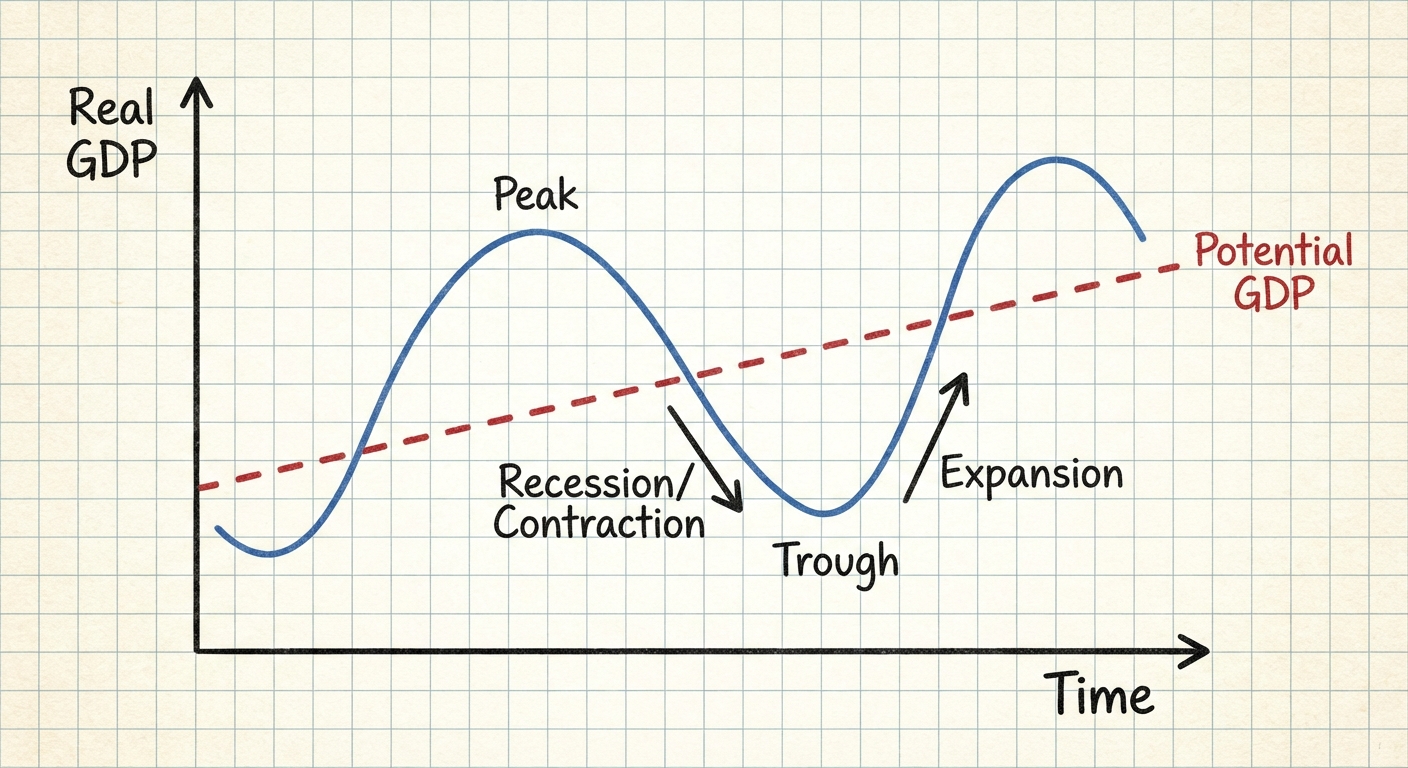
Actual vs. Potential Output
- Potential GDP ($Y_p$): The level of Real GDP produced when the economy is at "Full Employment" (NRU). It represents the economy's long-run capacity.
- Output Gap: The difference between Actual GDP ($Y$) and Potential GDP ($Y_p$).
Connecting Gaps to Policy
- Recessionary Gap ($Y < Y_p$): Actual output is below potential. Unemployment is high (above NRU).
- Inflationary Gap ($Y > Y_p$): Actual output is temporarily exceeding potential. Unemployment is extremely low (below NRU), leads to high inflation.
Study Summary Table
| Economic Condition | Real GDP | Unemployment | Inflation (usually) |
|---|---|---|---|
| Recession | Falling | Rising | Falling |
| Expansion | Rising | Falling | Rising |
| Full Employment | At Potential | At NRU | Stable |