Foundations of Spatial Analysis in Human Geography
Understanding Spatial Concepts
Geography is far more than memorizing capitals; it is the study of the "why of where." To analyze human behavior geographically, you must master the vocabulary describing how things are arranged in space.
Location: Absolute vs. Relative
Location is the position that something occupies on Earth's surface. Geographers describe it in two specific ways:
Absolute Location
- Definition: The exact point on Earth where something is located, usually defined by a coordinate system.
- Key Characteristics: It never changes. It is mathematical and unique to that distinct place.
- Example: The Empire State Building is at 40.7484° N, 73.9857° W.
Relative Location
- Definition: Describing a location based on its relationship to other objects or places.
- Key Characteristics: It can change over time as transportation and connectivity evolve. It focuses on connectivity and context.
- Example: "Singapore is located at a strategic choke point between the Indian and Pacific Oceans." (This explains why Singapore is wealthy, unlike just listing its latitude).
Place: The Distinctive Character
While location is a point in space, Place refers to the physical and human characteristics that distinguish one location from another. This is often broken down into Site and Situation.
- Site (Physical Character): The actual ground on which a settlement is built. This includes climate, water sources, topography, soil quality, and latitude.
- Example: New Orleans has a poor site because it is below sea level and prone to flooding.
- Situation (Relative Importance): The location of a place relative to other places. This involves connections, trade routes, and accessibility.
- Example: New Orleans has an excellent situation because it is at the mouth of the Mississippi River, serving as a gateway to the Gulf of Mexico.
Space, Flow, and Distance
Space refers to the physical gap or interval between two objects. To analyze space, geographers look at three main concepts:
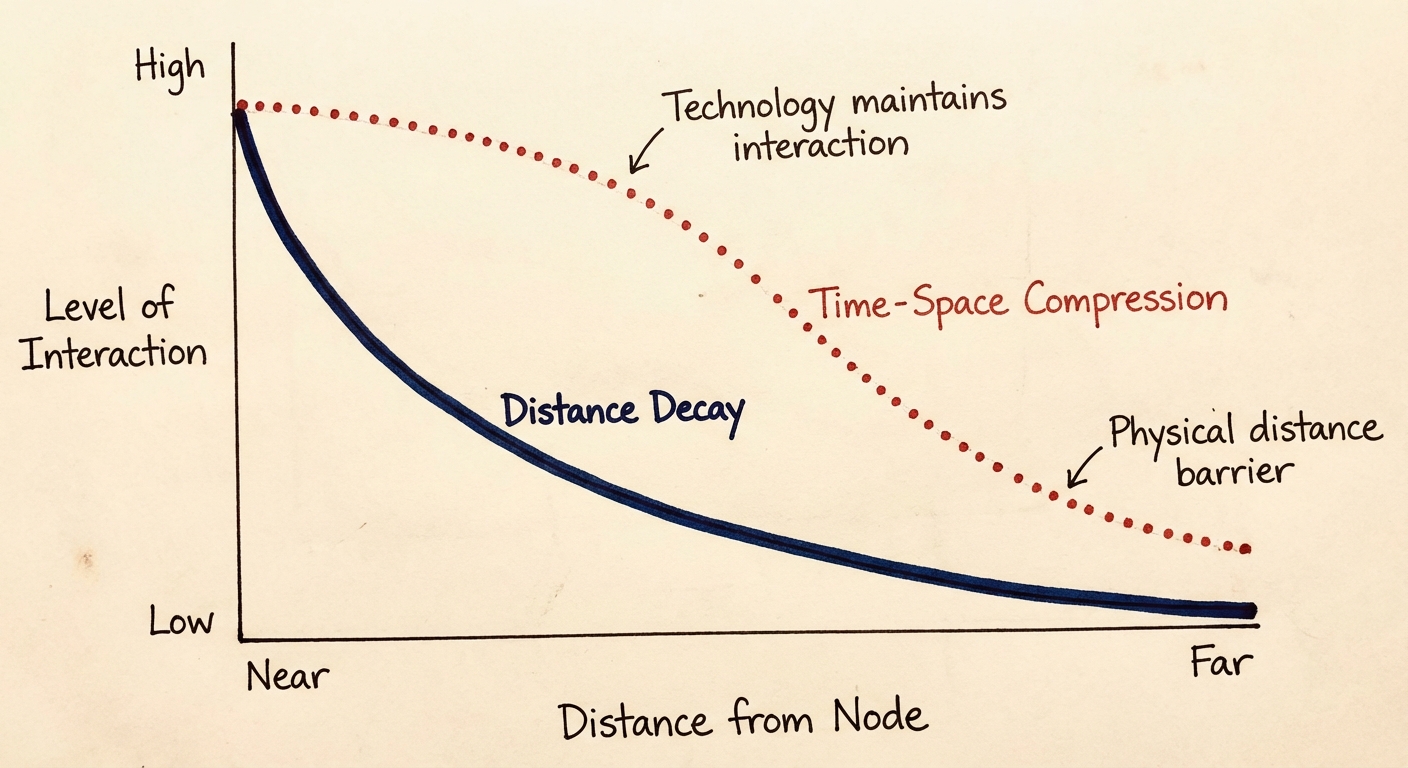
- Distance Decay: The principle that the farther away one group is from another, the less likely they are to interact. Interaction diminishes as distance increases.
- Time-Space Compression: The reduction in the time it takes to diffuse something to a distant place as a result of improved communications and transportation systems. This essentially "shrinks" the world, mitigating distance decay.
- Example: In 1850, it took weeks to send a message across the Atlantic. Today, the internet makes it instantaneous.
- Pattern: The geometric arrangement of objects in space (linear, centralized, or random).
Human-Environment Interaction (HEI)
This theme explores the reciprocal relationship between humans and the physical world. How do we affect the earth, and how does the earth affect us? The AP curriculum focuses heavily on the evolution of this academic thought.
Theories of Interaction
| Theory | Definition | Key Concept | Modern Perspective |
|---|---|---|---|
| Environmental Determinism | The belief that the physical environment causes social development and human behavior. | "Climate dictates culture." Used heavily in the 19th/20th century to justify colonialism (claiming temperate climates produced "superior" civilizations). | Largely rejected by modern geographers as scientifically flawed and racist. |
| Possibilism | The physical environment may limit some human actions, but people have the ability to adjust to their environment. | "Climate limits, deep culture adapts." Humans can overcome physical constraints through technology. | The dominant view in modern geography. |
Examples of Possibilism:
- Skiing in Dubai: Using indoor climate control to overcome a desert hot environment.
- Polders in the Netherlands: Draining water from the sea to create arable land.
- Terrace Farming: Cutting steps into mountains (like the Incas) to farm where flat land doesn't exist.
Regional Analysis
A Region is an area of Earth defined by one or more distinctive characteristics. Geographers categorize regions into three distinct types. You must know the difference between these for the exam.
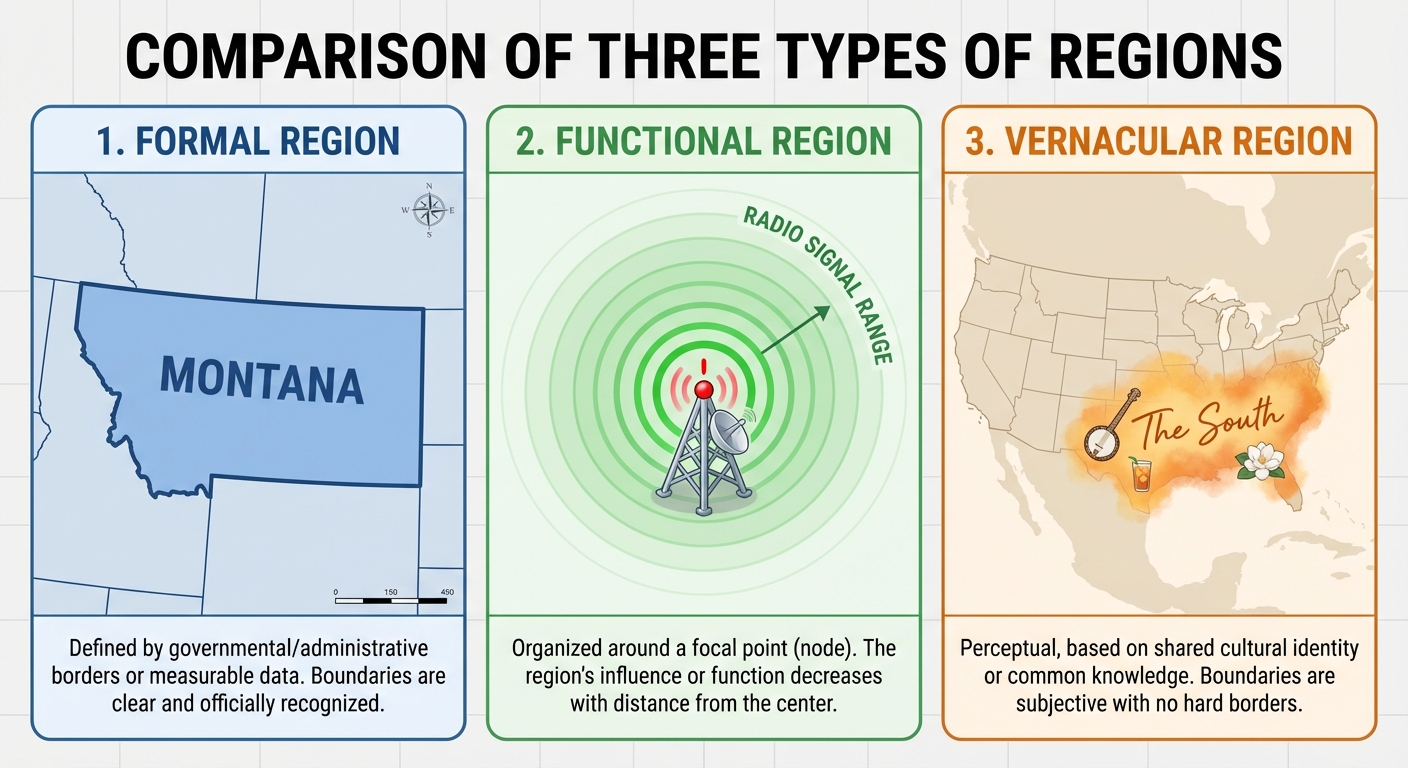
1. Formal (Uniform) Region
- Definition: An area within which everyone shares in common one or more distinctive characteristics.
- Basis: Measurable data. Facts.
- Borders: usually well-defined and easy to map.
- Examples:
- Cultural: A Spanish-speaking country.
- Political: The State of Montana; The European Union.
- Environmental: The Wheat Belt (an area where wheat is the predominant crop).
2. Functional (Nodal) Region
- Definition: An area organized around a node or focal point. The characteristic dominates at the center and diminishes in importance outward.
- Basis: Interaction, movement, or economic connection.
- Borders: Defined by the limit of the signal, delivery range, or commute.
- Examples:
- A Pizza delivery zone (the shop is the node).
- The reception area of a TV station.
- A metropolitan area (commuters traveling into the city center).
3. Vernacular (Perceptual) Region
- Definition: An area that people believe exists as part of their cultural identity.
- Basis: Opinions, stereotypes, and mental maps.
- Borders: Fuzzy and subjective; different people will draw the borders differently.
- Example: "The South" in the US. Is Florida in the South? Is Texas? It depends on who you ask, based on accents, food preference (grits/sweet tea), or history.
Scales of Analysis
This is statistically the most confusing topic for AP Human Geography students. You must distinguish between Map Scale and Scale of Analysis.
Map Scale (Cartographic Scale)
This refers to the relationship between the size of an object on a map and its actual size on Earth.
- Small Scale Map: Shows a Large Area with little detail.
- Think: "Global View" or World Map.
- Ratio: 1:1,000,000 (The number on the right is huge).
- Large Scale Map: Shows a Small Area with great detail.
- Think: "Zoomed In" or Map of a High School.
- Ratio: 1:10,000.
Mnemonic: "Small scale, small detail. Large scale, large detail."
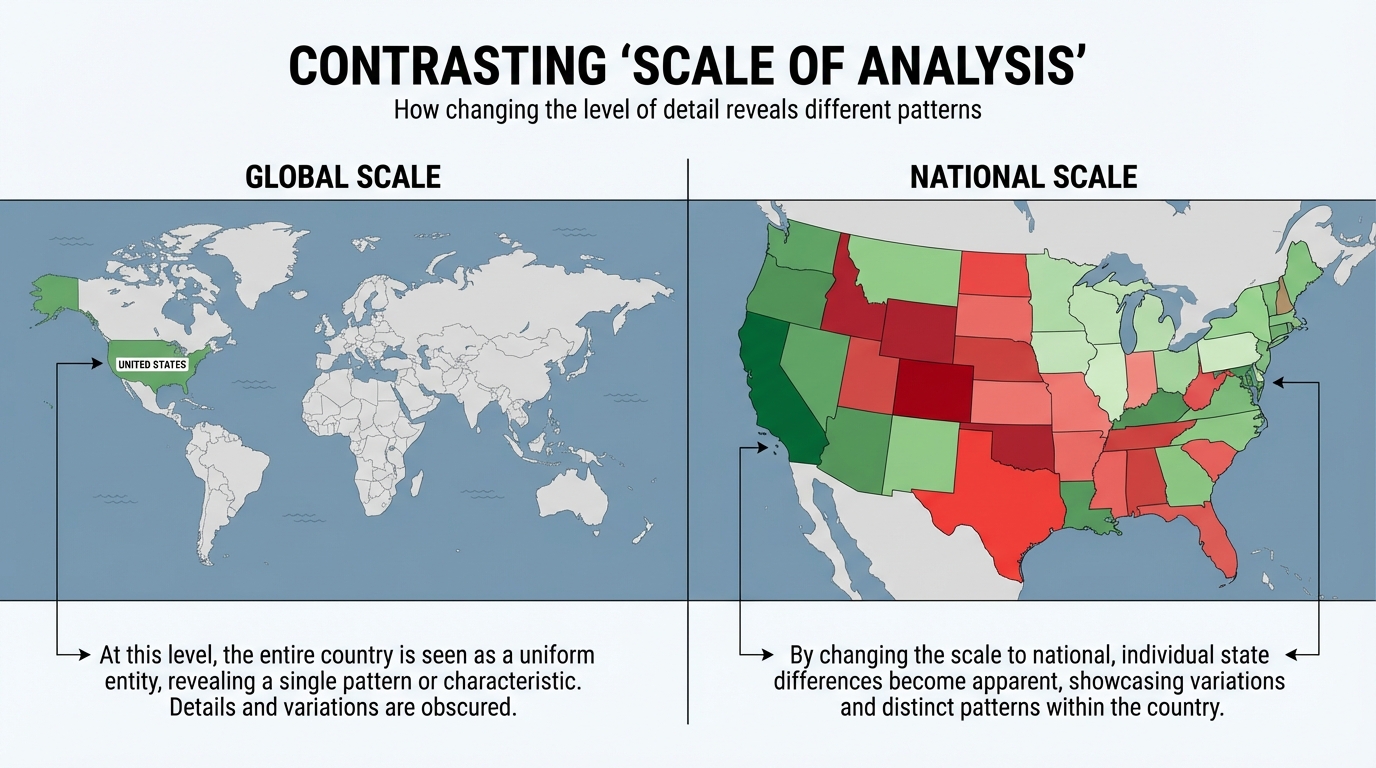
Scale of Analysis (Data Aggregation)
This refers to the level at which data is gathered and questioned (Global, National, Sub-national/State, Local). Changing the scale of analysis changes the pattern you see.
The Ecological Fallacy: Assuming that a generalization made at a broad scale applies to a specific locality.
Example of Changing Scale:
- Global Scale: You look at a map of average income worldwide. The US looks wealthy.
- National Scale: You look at the US by state. Mississippi looks poor compared to New York. (The pattern changes).
- Local Scale: You look at a specific county in Mississippi. You might find a wealthy gated community inside that "poor" state. (The pattern changes again).
Common Mistakes & Pitfalls
Site vs. Situation:
- Mistake: Describing a city's "Situation" by listing its natural resources.
- Correction: Remember SITuation is about CITies interacting (connections/trade). Site is the dirt/climate.
Environmental Determinism:
- Mistake: Thinking Determinism is just "valuing nature."
- Correction: Determinism is a rigid, often scientifically invalid theory that claimed potential is locked by geography. Possibilism is the correct modern framework.
Confusing Scales:
- Mistake: Thinking a "Large Scale" map covers a whole country.
- Correction: Remember the Zoom. If you Zoom In (make things look Large), you see a small area. That is a Large Scale map (e.g., a city street map).
Region Overlap:
- Mistake: Thinking a place can only be one type of region.
- Correction: Atlanta is a Formal region (City limits), the node of a Functional region (Airport hub), and part of a Vernacular region (The South). Layers overlap!