Study Notes: Introduction to Sampling Distributions and Variability
AP Statistics Unit 5: Sampling Distributions & Variability
The Concept of a Sampling Distribution
Before diving into inference, you must master the bridge between probability and statistics: the sampling distribution. This concept explains how sample statistics behave if we repeated the sampling process infinitely.
Parameters vs. Statistics
To understand sampling distributions, you must distinctively identify the source of a number.
- Parameter: A number that describes some characteristic of a population. In statistical practice, the value of a parameter is usually unknown.
- Statistic: A number that describes some characteristic of a sample. The value of a statistic can be computed directly from the sample data and is used to estimate the parameter.
Memory Aid:
- Parameter $
ightarrow$ Population- Statistic $
ightarrow$ Sample
Notation Guide
Using correct notation is critical on the AP exam.
| Measure | Population Parameter | Sample Statistic |
|---|---|---|
| Mean | $\mu$ (mu) | $\bar{x}$ (x-bar) |
| Proportion | $p$ | $\hat{p}$ (p-hat) |
| Standard Deviation | $\sigma$ (sigma) | $s$ |
Defining the Sampling Distribution
Imagine taking a sample of 50 students and calculating their average GPA. You get 3.2. If you take another random sample of 50 students, you might get 3.4. If you take a third, you might get 3.1.
A Sampling Distribution is the probability distribution of a statistic (like $\bar{x}$ or $\hat{p}$) for all possible samples of the same size ($n$) from the same population.
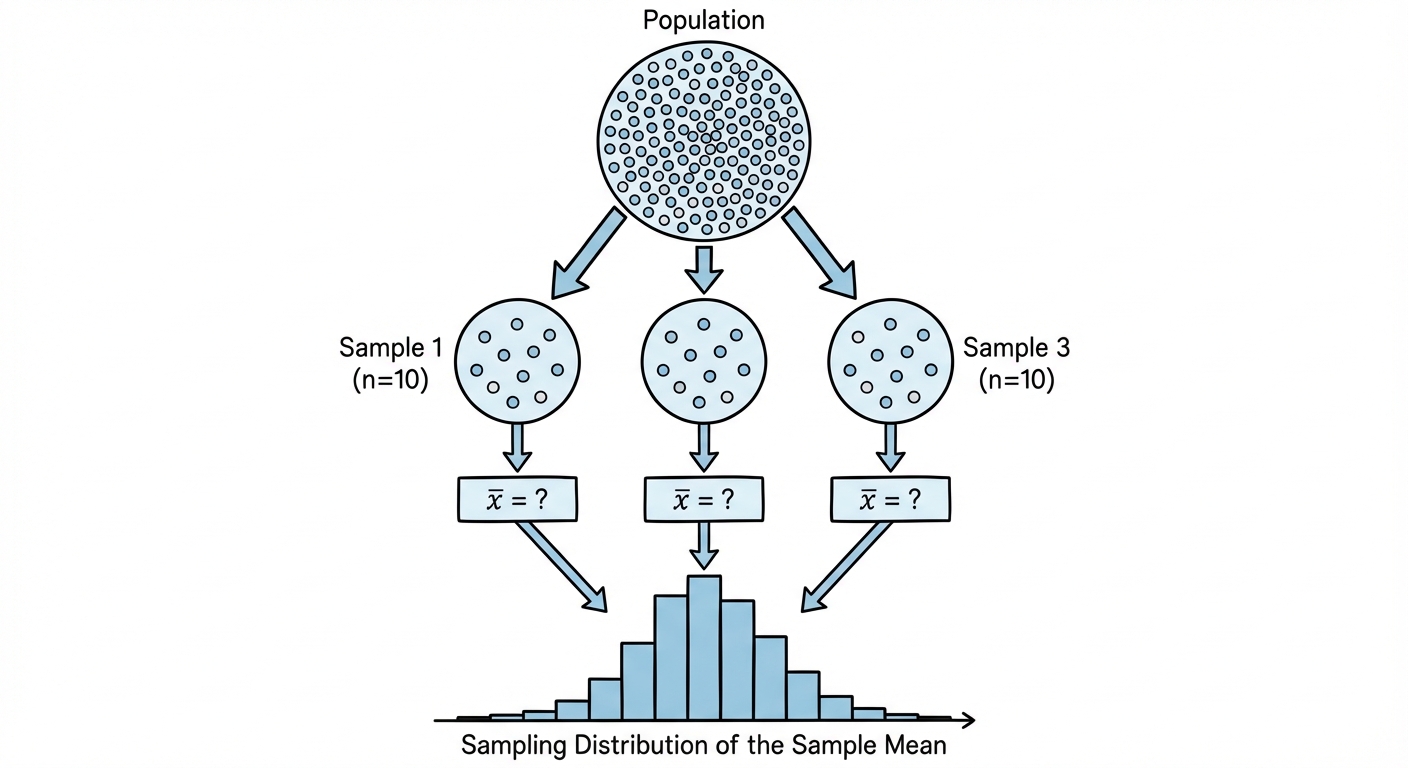
Three Distinct Distributions
Do not confuse these three distinct concepts:
- Population Distribution: The distribution of values of the variable among all individuals in the population. (Describe using $\mu$ and $\sigma$).
- Distribution of Sample Data: The distribution of values within a single sample. (Describe using $\bar{x}$ and $s$).
- Sampling Distribution: The distribution of the statistic values collected from many, many samples.
Variation in Statistics for Samples from the Same Population
Sampling Variability
Sampling Variability refers to the fact that different random samples of the same size from the same population produce different values for a statistic.
For example, if the true proportion of voters supporting candidate A is $p=0.60$, one sample might show $\hat{p}=0.58$, another $\hat{p}=0.63$, and another $\hat{p}=0.55$. This is not a mistake; it is the natural consequence of random sampling.
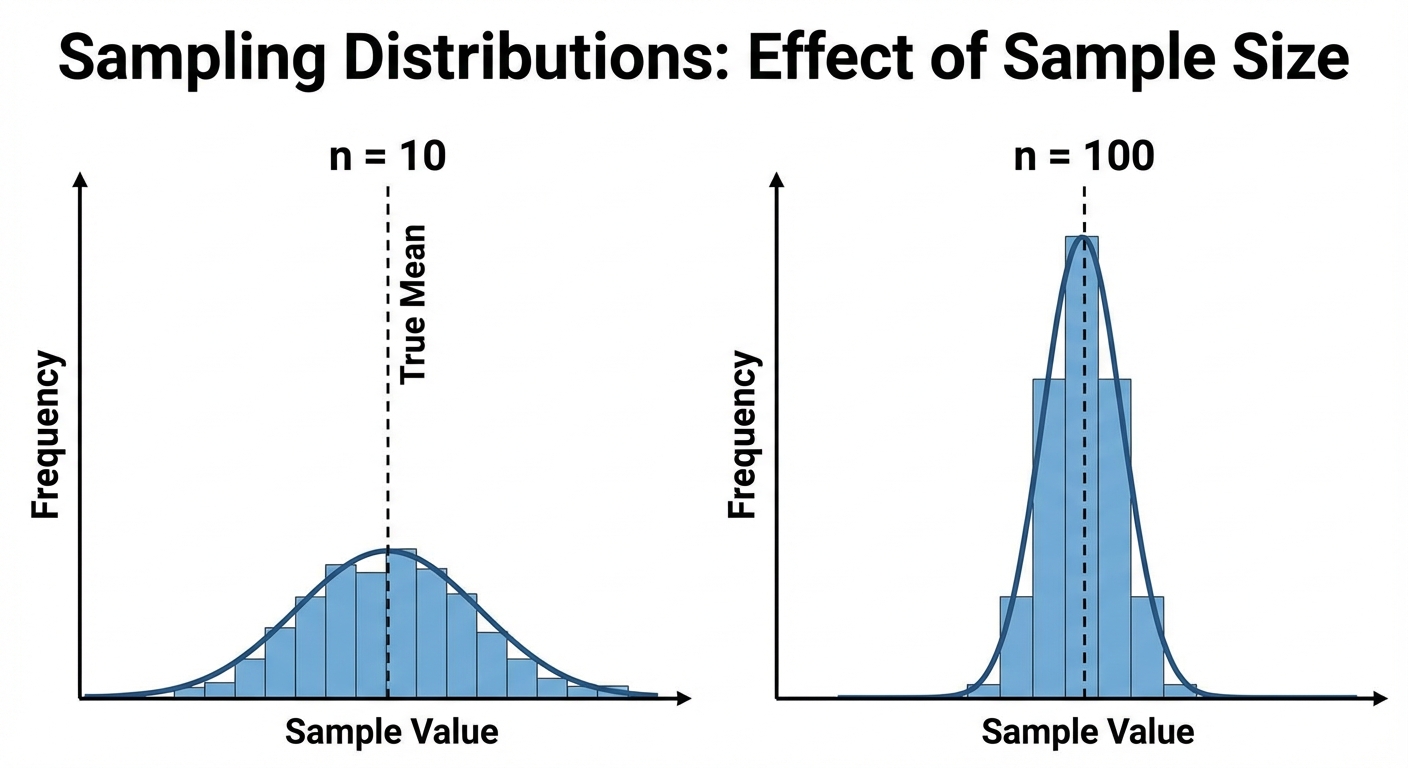
The Effect of Sample Size on Variability
The spread (variability) of a sampling distribution is determined primarily by the sample size, $n$.
- Larger samples ($n$) $\rightarrow$ Lower variability.
- Smaller samples ($n$) $\rightarrow$ Higher variability.
Think about it: Statistical outliers have less impact on the average as the group gets larger. If we sample $n=1000$ people, the resulting method will likely be very close to the true population parameter. If we sample $n=5$, the result could vary wildly from the truth.
Key Rule: The variability of a statistic is described by the spread of its sampling distribution. This spread does not depend on the size of the population, provided the population is at least 10 times larger than the sample (the 10% Condition).
Biased and Unbiased Point Estimates
When we use a sample statistic to estimate a population parameter, we want the estimation method to be both accurate (low bias) and precise (low variability).
Point Estimators
A Point Estimator is a statistic that provides an estimate of a population parameter. The specific value obtained from a sample is called a point estimate.
Unbiased Estimators
A statistic is an unbiased estimator if the mean of its sampling distribution is equal to the true value of the parameter being estimated.
Mathematically, this means:
- For Proportions: $\mu_{\hat{p}} = p$
- For Means: $\mu_{\bar{x}} = \mu$
If you took infinite samples and averaged all the $\bar{x}$ values you obtained, that average would perfectly equal the true population mean $\mu$. Therefore, the sample mean $\bar{x}$ is an unbiased estimator.
Biased Estimators
A statistic is biased if the mean of its sampling distribution clearly overestimates or underestimates the parameter.
Example: Range. The sample range is a biased estimator because small samples tend to have smaller ranges than the full population. The mean of the sample ranges will strictly be less than the population range.
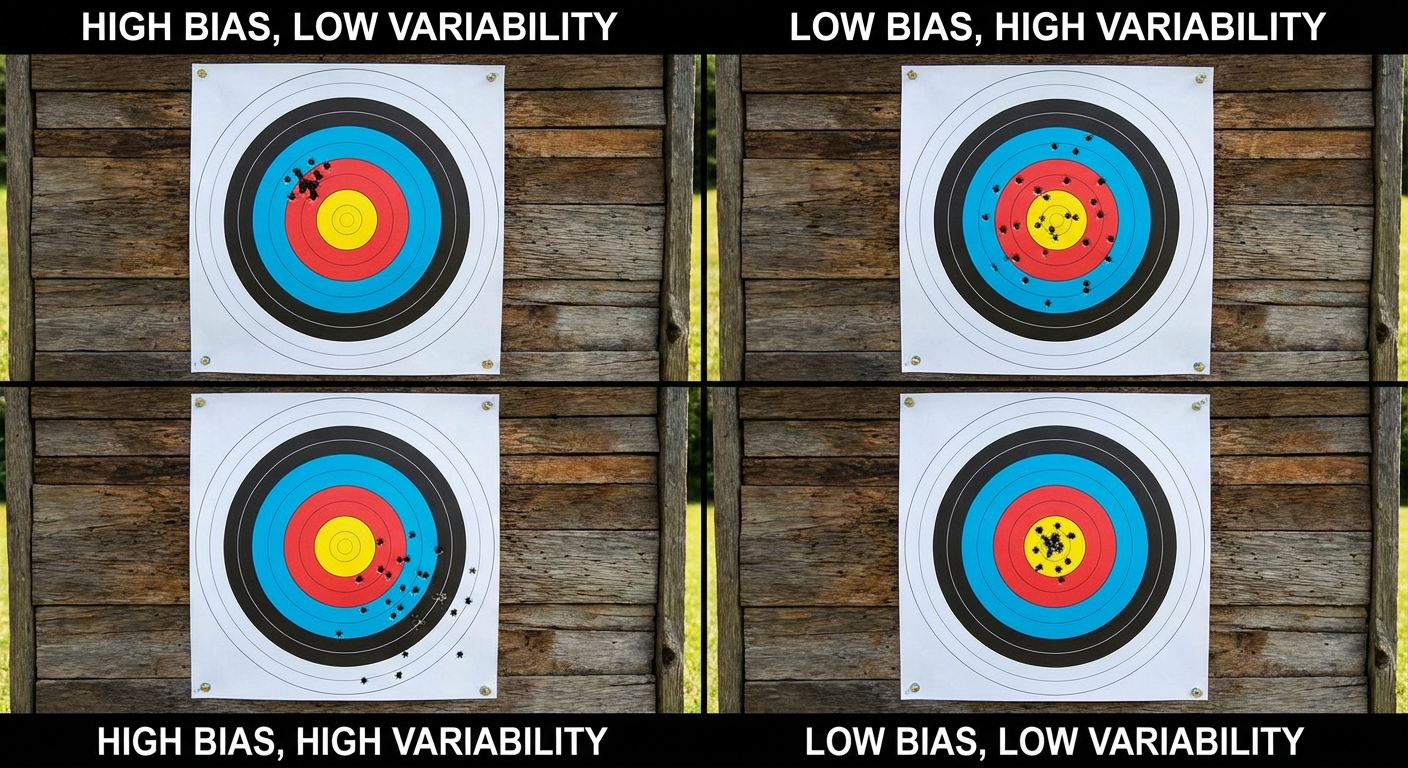
Bias vs. Variability (The Target Analogy)
The relationship between bias and variability is best understood using a bullseye target, where the center is the true population parameter.
- High Bias: The shots are clustered, but far away from the bullseye.
- High Variability: The shots are centered around the bullseye, but spread out very widely.
- Low Bias, Low Variability: All shots are tightly clustered right in the bullseye (This is the goal!).
Common Mistakes & Pitfalls
Confusing the "Distribution of the Sample" with the "Sampling Distribution"
- Mistake: Thinking the sampling distribution looks like the sample data.
- Correction: The sampling distribution is a theoretical graph of statistics (averages or proportions) from many samples, not the raw data points from one sample.
Misunderstanding Sample Size vs. Population Size
- Mistake: Thinking that to get a precise estimate, you need to sample a large percentage of the population (e.g., "We need 10% of the US population").
- Correction: Precision depends on the sample size ($n$) itself, not the fraction of the population sampled (as long as the population is much larger than the sample).
Notation Errors
- Mistake: Using $\mu$ when referring to a sample mean, or $\bar{x}$ when referring to the population mean.
- Correction: Always ask, "Is this number coming from a sample (Latin letters) or the whole group (Greek letters)?"
Bias definition
- Mistake: Thinking bias refers to a single bad sample.
- Correction: Bias is a property of the sampling method or design. It means the center of the sampling distribution is "off target."