AP Macro Unit 4: The Financial Sector & Monetary Policy
4.1 Financial Assets
Definitions & Concepts
Financial Assets are written claims where the buyer of the asset has the right to future income from the seller. Unlike real assets (houses, equipment), financial assets represent a claim to value rather than the physical value itself.
- Liquidity: The ease with which an asset can be converted into cash (the medium of exchange) without significant loss of value.
- Most Liquid: Cash, Checking Accounts (Demand Deposits).
- Least Liquid: Real Estate, Fine Art, Collectibles.
- Return (Rate of Return): The profit earned on an investment relative to its cost.
- Risk: The uncertainty that an investment will earn its expected rate of return.
- Relationship: There is a direct relationship between risk and return. High-risk assets generally must offer a higher potential return to entice investors.
Types of Financial Assets
| Asset | Definition | Financing Type | Risk Profile |
|---|---|---|---|
| Stock (Equity) | Represents partial ownership in a firm. Stockholders have a claim on profits (dividends) and usually have voting rights. | Equity Financing | Higher Risk (last to be paid in bankruptcy) |
| Bond (Securities) | A certificate of indebtedness (IOU). The borrower promises to pay back the principal (face value) plus fixed interest payments. | Debt Financing | Lower Risk (paid before stockholders) |
| Loan | An agreement between a lender (usually a bank) and a borrower. Unlike bonds, these are usually non-tradable. | Debt Financing | Varies |
The Inverse Relationship: Bond Prices & Interest Rates
This is one of the most frequently tested concepts in AP Macroeconomics.
- Concept: Previously issued bonds possess a fixed interest payment (coupon payment). If new interest rates in the economy rise, the old bonds with lower rates become less attractive, so their price falls.
- The Rule:
- If Interest Rates $\uparrow$ $\rightarrow$ Bond Prices $\downarrow$
- If Interest Rates $\downarrow$ $\rightarrow$ Bond Prices $\uparrow$

Common Mistakes
- Thinking stocks and bonds are the same: Stocks are ownership; bonds are loans.
- Confusing the relationship: Remember the teeter-totter. When high-yield new bonds appear, nobody wants your old low-yield bond unless you put it on sale (lower the price).
4.2 Nominal vs. Real Interest Rates
Interest Rates Defined
Interest rates are essentially the "price" of borrowing money.
- Nominal Interest Rate ($i$): The stated interest rate paid on a loan/bond. It is not adjusted for inflation. It measures the increase in the dollar amount of money.
- Real Interest Rate ($r$): The interest rate adjusted for the effects of inflation. It measures the increase in purchasing power.
The Fisher Equation
To calculate the real interest rate, use the Fisher Equation:
Application: Winners and Losers from Unexpected Inflation
If actual inflation is higher than expected inflation:
- Borrowers Win: They repay loans with money that has less purchasing power than expected.
- Lenders Lose: They receive money that buys less than they anticipated when they set the interest rate.
4.3 Definition, Measurement, and Functions of Money
The Three Functions of Money
For an asset to serve as money, it must fulfill three roles:
- Medium of Exchange: Generally accepted for payment of goods and services (replaces the inefficient barter system).
- Unit of Account: Measures the relative value of things (e.g., a "price tag"). It allows us to compare the value of a car vs. a banana.
- Store of Value: Allows purchasing power to be saved for the future (assuming low inflation). If money rots (like fruit), it is a poor store of value.
Types of Money
- Commodity Money: Has intrinsic value (e.g., Gold, Cigarettes in prison, Salt). It has value even if not used as money.
- Fiat Money: Has no intrinsic value (e.g., Paper dollars). It has value only because the government says so and the public trusts it.
The Money Supply Measures
The Federal Reserve (The Fed) tracks the money supply in categories.
| Measure | Liquidity | Components |
|---|---|---|
| M1 | High | Currency in circulation (Cash) + Checkable/Demand Deposits + Traveler's Checks |
| M2 | Lower | Everything in M1 + Savings Deposits + Money Market Accounts + Small Time Deposits (CDs) |
The Monetary Base vs. Money Supply
Do not confuse these two terms.
- Monetary Base (High-powered money): Currency in Circulation + Bank Reserves.
- Money Supply (M1/M2): Currency in Circulation + Checkable Deposits.
Key Difference: Bank reserves are part of the Monetary Base but NOT the Money Supply (because money sitting in a bank vault is not "circulating").
4.4 Banking and Money Creation
Fractional Reserve Banking
Banks operate on a fractional reserve system, meaning they only hold a small portion of deposits in reserve and lend out the rest. This lending process creates new money.
Key Terms & T-Accounts
- Assets: What the bank owns (Loans, Reserves, Bonds).
- Liabilities: What the bank owes (Demand Deposits/Checking Accounts, Owner's Equity).
- Required Reserves: The specific % of deposits the Fed requires banks to hold ($Deposit \times Reserve Ratio$).
- Excess Reserves: Actual Reserves - Required Reserves. Only Excess Reserves can be lent out.
The Money Multiplier
When a bank lends excess reserves, that money is deposited in another bank, which lends a portion of it, and so on.
Maximum Money Creation Formulas
- Change in Loans/Money Supply:
- Total Change in Demand Deposits:
Leakages
The maximum multiplier is rarely reached in the real world due to:
- Cash Leakage: Borrowers holding some cash rather than redepositing it.
- Excess Reserves: Banks choosing to hold more reserves than required (for safety).
4.5 The Money Market
This market looks at the supply and demand for the entire money stock (M1).
- Y-Axis: Nominal Interest Rate ($i$)
- X-Axis: Quantity of Money ($Q_m$)
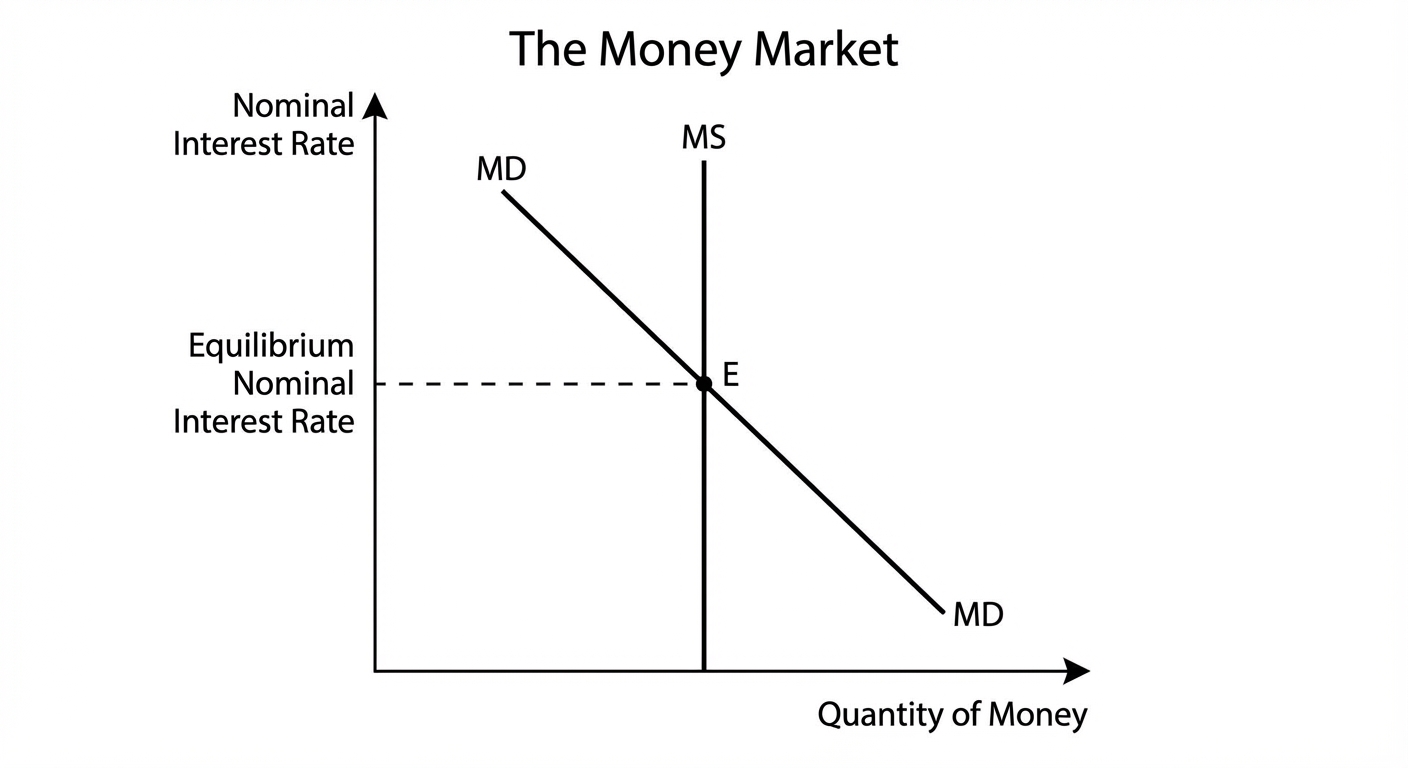
Money Demand ($M_D$)
The inverse relationship between nominal interest rates and quantity of money demanded.
- Transaction Demand: Money needed to buy goods interaction (price level/GDP dependent).
- Asset Demand: Money held as a store of value.
- Logic: As interest rates rise, the opportunity cost of holding cash increases (you are losing out on interest), so you hold less cash.
Shifters of Money Demand
- Price Level: Prices $\uparrow$ $\rightarrow$ Need more cash to buy things $\rightarrow$ $M_D$ shifts Right.
- Real GDP (Income): Income $\uparrow$ $\rightarrow$ more transactions $\rightarrow$ $M_D$ shifts Right.
- Technology: Credit cards/Apple Pay make holding cash less necessary $\rightarrow$ $M_D$ shifts Left.
Money Supply ($M_S$)
- Curve: Vertical line.
- Why? The supply is determined solely by the Federal Reserve's monetary policy, not the interest rate.
4.6 Monetary Policy
The central bank (The Fed) manipulates the Money Supply to influence the economy.
The Transmission Mechanism
- Fed increases $M_S$.
- Nominal Interest Rate ($i$) falls.
- Because $i$ falls, Investment ($I$) and Interest-Sensitive Consumption ($C$) increase.
- Aggregate Demand ($AD$) increases.
Tools of the Federal Reserve
1. Open Market Operations (OMO) - Most Important Tool
The buying and selling of government bonds (securities).
- Buying Bonds (Expansionary): The Fed buys a bond from a bank $\rightarrow$ The Fed gives the bank money $\rightarrow$ Bank Excess Reserves $\uparrow$ $\rightarrow$ Money Supply $\uparrow$.
- Mnemonic: BB = BB (Buying Bonds = Big Bucks / Bigger Money Supply)
- Selling Bonds (Contractionary): The Fed sells a bond to a bank $\rightarrow$ The bank pays the Fed money $\rightarrow$ Bank Excess Reserves $\downarrow$ $\rightarrow$ Money Supply $\downarrow$.
- Mnemonic: SB = SB (Selling Bonds = Small Bucks / Smaller Money Supply)
2. The Discount Rate
The interest rate the Fed charges banks for short-term loans.
- Decrease Rate: Banks borrow more $\rightarrow$ Reserves $\uparrow$ $\rightarrow$ $M_S \uparrow$ (Expansionary).
- Increase Rate: Banks borrow less $\rightarrow$ Reserves $\downarrow$ $\rightarrow$ $M_S \downarrow$ (Contractionary).
3. The Reserve Requirement (Reserve Ratio)
The % of deposits banks must keep.
- Decrease Ratio: More money becomes "excess" $\rightarrow$ $M_S \uparrow$ (Expansionary).
- Increase Ratio: More money is "required" $\rightarrow$ Banks lend less $\rightarrow$ $M_S \downarrow$ (Contractionary).
4. Administered Interest Rates (Interest on Reserves)
The Fed pays banks interest on reserves held at the Fed.
- Lower IOR: Banks have less incentive to keep reserves $\rightarrow$ Lending $\uparrow$ $\rightarrow$ $M_S \uparrow$.
- Raise IOR: Banks keep money at the Fed to earn risk-free interest $\rightarrow$ Lending $\downarrow$ $\rightarrow$ $M_S \downarrow$.

4.7 The Loanable Funds Market
This market determines the Real Interest Rate ($r$). It brings together savers (supply) and borrowers (demand).
- Y-Axis: Real Interest Rate ($r$)
- X-Axis: Quantity of Loanable Funds ($Q_{LF}$)

Supply of Loanable Funds ($S_{LF}$)
Who supplies the money? SAVERS.
- Source: Household savings, Government surplus, Foreign capital inflow.
- Slope: Upward (Higher interest rates encourage people to save more).
- Shifters:
- Changes in private savings behavior.
- Changes in capital inflows (foreign investors shifting money into the country).
Demand for Loanable Funds ($D_{LF}$)
Who demands the money? BORROWERS.
- Source: Firms (for Investment), Government (Deficit spending).
- Slope: Downward (Lower interest rates encourage borrowing).
- Shifters:
- Changes in business opportunities/profitability.
- Government Deficit Spending (Government demands loans to pay bills).
Crowding Out
This is a critical concept connecting Fiscal Policy to the Financial Sector.
- The Government utilizes Expansionary Fiscal Policy (Deficit Spending).
- The Government must borrow money to fund the deficit.
- Demand for Loanable Funds ($D_{LF}$) shifts Right.
- Real Interest Rates ($r$) Increase.
- Because $r$ is higher, Private Business Investment ($I$) decreases.
Result: Government spending "crowds out" private investment, potentially dampening long-term economic growth.
Unit 4 Common Mistakes & Pitfalls
- Money Market vs. Loanable Funds:
- If the question asks about the Fed/Monetary Policy $\rightarrow$ Draw Money Market (Nominal Interest Rate).
- If the question asks about Savings, Deficits, or Long-term Investment $\rightarrow$ Draw Loanable Funds (Real Interest Rate).
- Bond Prices: Students often forget that Bond Prices and Interest Rates move in opposite directions. If the Fed raises rates, your bond portfolio loses value.
- Reserves vs. Money Supply: When the Fed buys a bond from a bank, the immediate effect is an increase in the Monetary Base. The Money Supply only multiplies when the bank actually lends that money out.
- Buying/Selling: Students confuse who is buying/selling. "Fed sells bonds" means the Fed is giving paper (bonds) to the public and taking cash out of the economy (Contractionary).