Comprehensive Guide to Intelligence and Psychometrics
Theories of Intelligence
Intelligence is generally defined as the mental quality consisting of the ability to learn from experience, solve problems, and use knowledge to adapt to new situations. However, psychologists debate whether it is a single ability or a collection of distinct abilities.
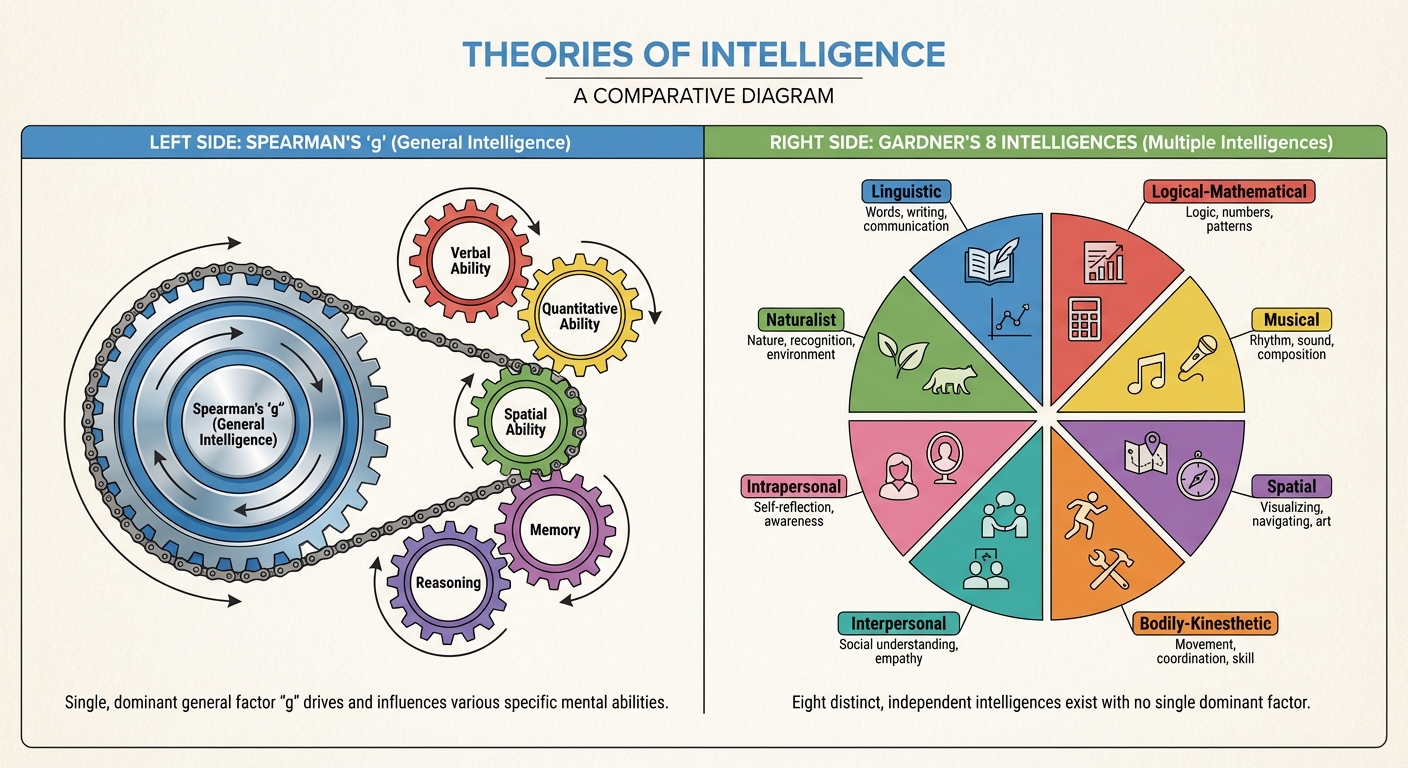
The "g" Factor (General Intelligence)
Proposed by Charles Spearman, the General Intelligence ($g$) theory suggests that a single underlying factor contributes to performance on various mental tests.
- Concept: If you score high on verbal intelligence, you are likely to score high on spatial or reasoning tasks.
- Evidence: Factor analysis (a statistical procedure) generally supports the idea that specific skills cluster together.
Multiple Intelligences
Opposing the single-factor theory, other psychologists argue for independent intelligences.
- Howard Gardner (Theory of Multiple Intelligences):
- Gardner identified 8 distinct intelligences: Linguistic, Logical-Mathematical, Musical, Spatial, Bodily-Kinesthetic, Intrapersonal (self), Interpersonal (others), and Naturalist.
- Evidence: Savant Syndrome—a condition where a person otherwise limited in mental ability has an exceptional specific skill (e.g., computation or drawing). This suggests intelligence is not a single unified entity.
- Robert Sternberg (Triarchic Theory):
Sternberg agreed with Gardner that there are multiple intelligences but simplified them into three distinct types (Mnemonic: PAC):
- Practical Intelligence: "Street smarts"; ability to adapt to everyday life and shape the environment.
- Analytical Intelligence: Academic problem solving; assessed by traditional IQ tests.
- Creative Intelligence: Ability to generate novel ideas and adapt to unique situations.
Emotional Intelligence (EQ)
Proposed by Salovey, Mayer, and popularized by Goleman, Emotional Intelligence is the ability to perceive, understand, manage, and use emotions.
- High EQ correlates with success in relationships, careers, and parenting, sometimes more so than high academic IQ.
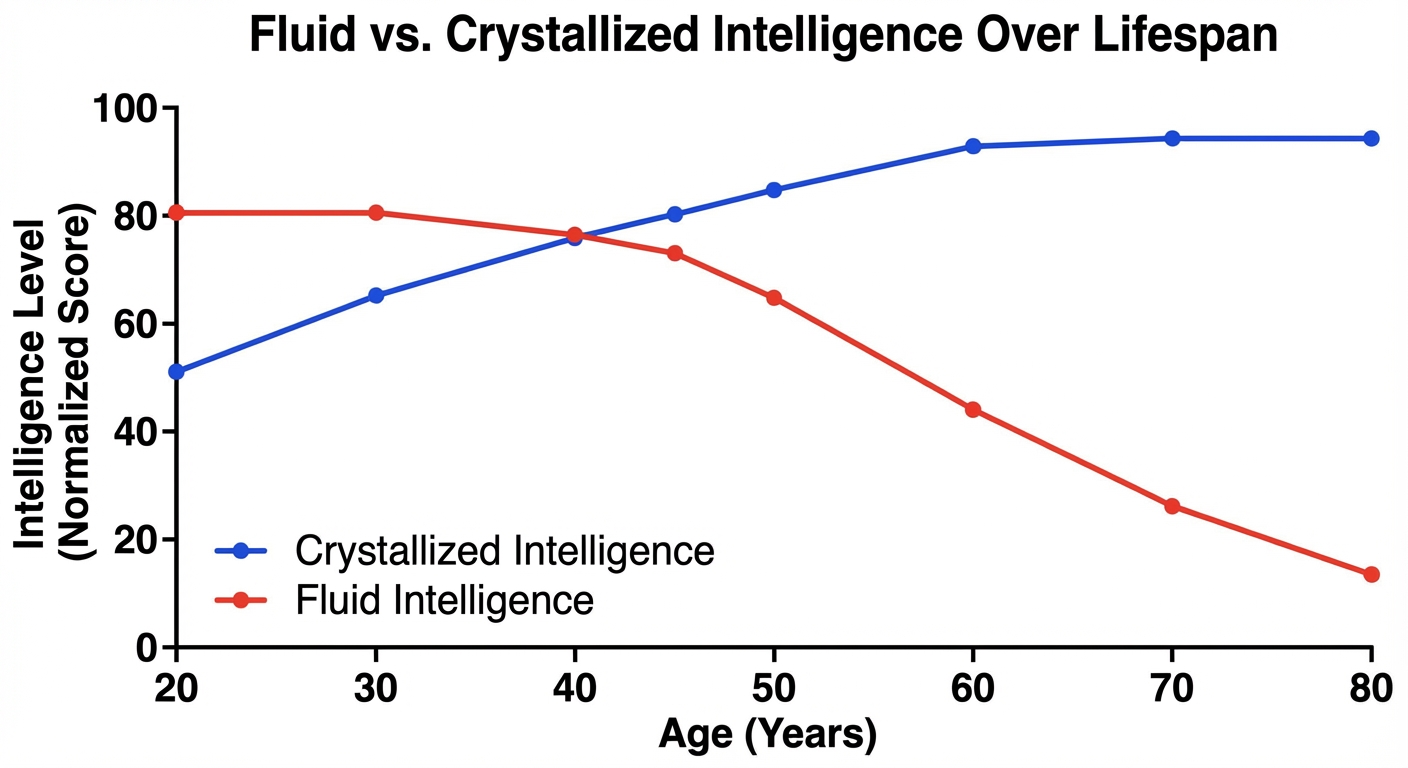
Fluid vs. Crystallized Intelligence
Psychologist Raymond Cattell identified two subtypes of intelligence that change differently over the lifespan.
- Fluid Intelligence: The ability to puzzle out new problems, use logic in new situations, and identify patterns. It tends to decrease beginning in late adulthood.
- Crystallized Intelligence: Accumulated knowledge and verbal skills (vocabulary, facts). It tends to increase or stay stable with age.
Intelligence Testing and Psychometrics
History of IQ Testing
Alfred Binet based in France:
- Commissioned to identify students effectively needing special help.
- Introduced the concept of Mental Age: The chronological age that most typically corresponds to a given level of performance.
- Note: Binet did not believe his test measured innate intelligence; he intended it for academic placement.
Lewis Terman (Stanford University):
- Adapted Binet’s test for American audiences, creating the Stanford-Binet.
- Used the classic Intelligence Quotient (IQ) formula popularized by William Stern:
- Example: An 8-year-old with the mental age of 10 has an IQ of:
David Wechsler:
- Created the most widely used modern tests: WAIS (Wechsler Adult Intelligence Scale) and WISC (Wechsler Intelligence Scale for Children).
- Differences from Binet: Wechsler tests yield an overall IQ score plus separate scores for verbal comprehension, perceptual organization, working memory, and processing speed.
Principles of Test Construction
For a psychological test to be accepted, it must meet three criteria: Standardization, Reliability, and Validity.
1. Standardization
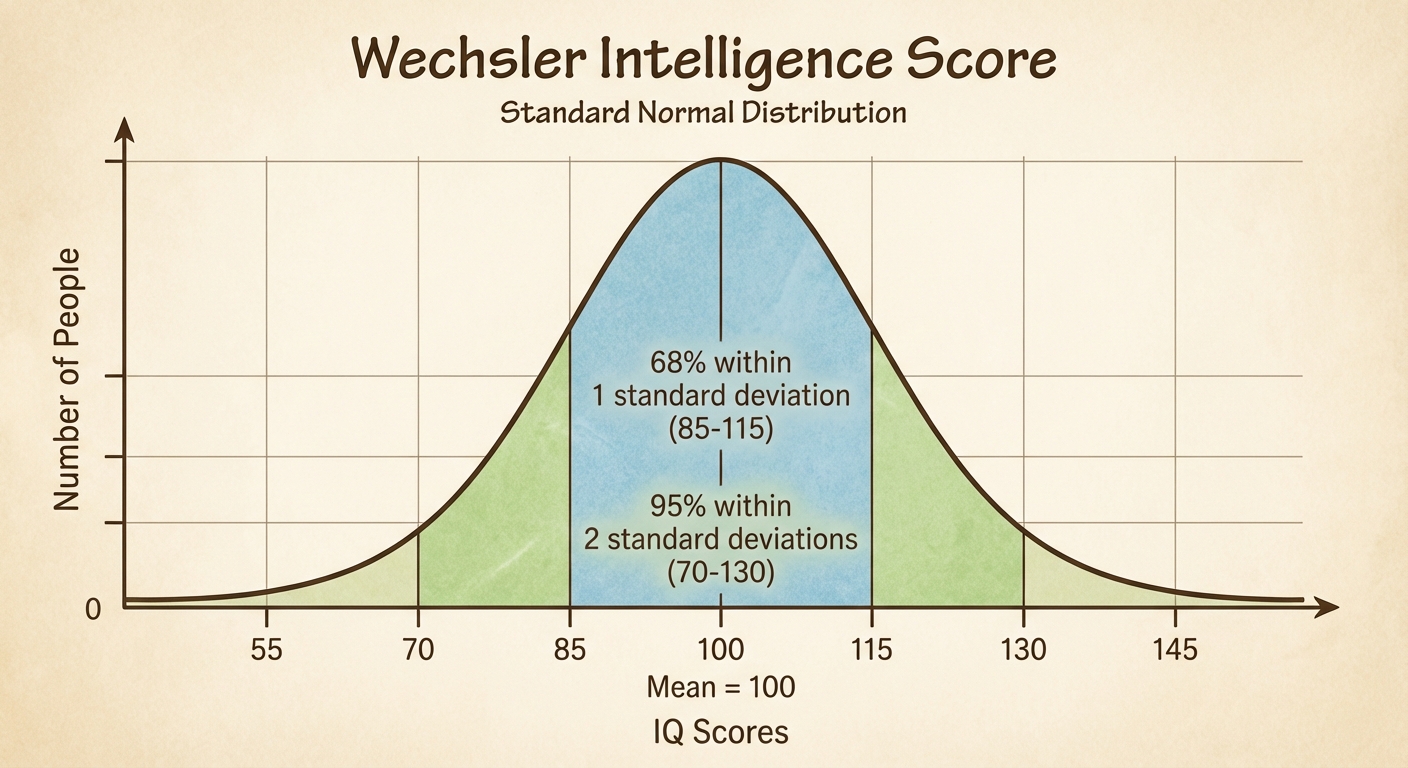
Defining meaningful scores by comparison with the performance of a pretested group (the "norm group"). This process typically produces a Normal Distribution (Bell Curve).
The Normal Curve (Key Stats):
- Mean: 100
- Standard Deviation (SD): 15
- 68% of people score between 85 and 115 (within 1 SD).
- 95% of people score between 70 and 130 (within 2 SDs).
- The Flynn Effect: The worldwide phenomenon where intelligence test performance has been improving over the last century due to better nutrition, education, and environment.
2. Reliability
The extent to which a test yields consistent results.
- Test-Retest Reliability: Comparing a test taker’s scores on the same test taken on separate occasions.
- Split-Half Reliability: Comparing scores on two halves of the test (e.g., odd vs. even questions) to ensure internal consistency.
3. Validity
The extent to which a test measures or predicts what it is supposed to.
- Content Validity: The test samples the behavior of interest (e.g., a driving test measures driving ability).
- Predictive Validity: The success with which a test predicts the behavior it is designed to predict (e.g., SAT scores predicting college GPA).
- Note: Aptitude tests (predicting ability to learn) generally have lower predictive validity as students age.
Bias, Heritability, and Extremes
Nature vs. Nurture in Intelligence
- Heritability: The portion of variation among individuals that we can attribute to genes. (Estimates for intelligence range from 50–80%).
- Twin Studies: Identical twins raised together have the most similar IQ scores. Identical twins raised apart have slightly less similar scores but are still highly correlated, showing the strength of genetics.
- Environment: Early intervention, nutrition, and schooling significantly impact intelligence scores, particularly for children in poverty.
Bias in Testing
There are two ways to define bias in testing:
- Scientific Bias: The test predicts future behavior only for some groups of test-takers and not others (validity statistical bias).
- Cultural Bias: The test detects not only innate intelligence but also performance differences caused by cultural experiences (e.g., asking questions about wine tasting to students from lower socio-economic backgrounds).
Stereotype Threat
A self-confirming concern that one will be evaluated based on a negative stereotype.
- Claude Steele’s Research: If African American students are told a test measures innate intelligence, they may perform worse due to the anxiety of confirming negative stereotypes. If told the test is a "problem-solving task," the score gap often disappears.
- This also applies to gender (e.g., women taking math tests).
Extremes of Intelligence
- Intellectual Disability: Condition of limited mental ability, indicated by an IQ score of 70 or below and difficulty adapting to the demands of life.
- Down Syndrome: A condition of mild to severe intellectual disability and associated physical disorders caused by an extra copy of chromosome 21.
- Giftedness: IQ scores above 130. Terman's longitudinal study showed that high-IQ children (termed "Termites") were healthy, well-adjusted, and unusually successful academically.
Common Mistakes & Pitfalls
- Reliability vs. Validity: Students often confuse these. Remember: A broken clock that is always 5 minutes fast is Reliable (consistent) but not Valid (accurate).
- Aptitude vs. Achievement: Aptitude tests predict future ability (SAT/ACT). Achievement tests measure what you have already learned (AP Psychology Exam).
- Heritability Misconception: Heritability applies to groups, not individuals. We cannot say "50% of your intelligence is from your parents." We say "50% of the difference between people in this group is due to genetics."
- Correlation $\neq$ Causation: Just because high IQ correlates with longer life spans doesn't mean IQ causes longevity (though they are linked via education and health care access).