Unit 1: Foundations of Spatial Inquiry
Introduction to Maps and Spatial Data
Geography is not merely the memorization of capitals and flags; it is the spatial analysis of human and physical phenomena. To think geographically, you must master the tools geographers use to visualize the world.
Types of Locations
Understanding where things are is the starting point of geography.
- Absolute Location: The precise spot where something is according to a system.
- Example: GPS coordinates (27.17° N, 78.04° E) or a street address.
- Relative Location: Where something is in relation to other things. This can change over time as connectivity changes.
- Example: "The library is down the street from the high school, next to the coffee shop."
- Space vs. Place: Space refers to the physical gap between two objects, while Place refers to a specific point on Earth distinguished by a particular characteristic (human or physical).
Types of Maps
Maps are 2D representations of Earth's 3D surface. They generally fall into two categories:
- Reference Maps: Designed for people to refer to for general information about places.
- Political Maps: Show human created boundaries (countries, states, capitals).
- Physical Maps: Show natural features (mountains, rivers, deserts).
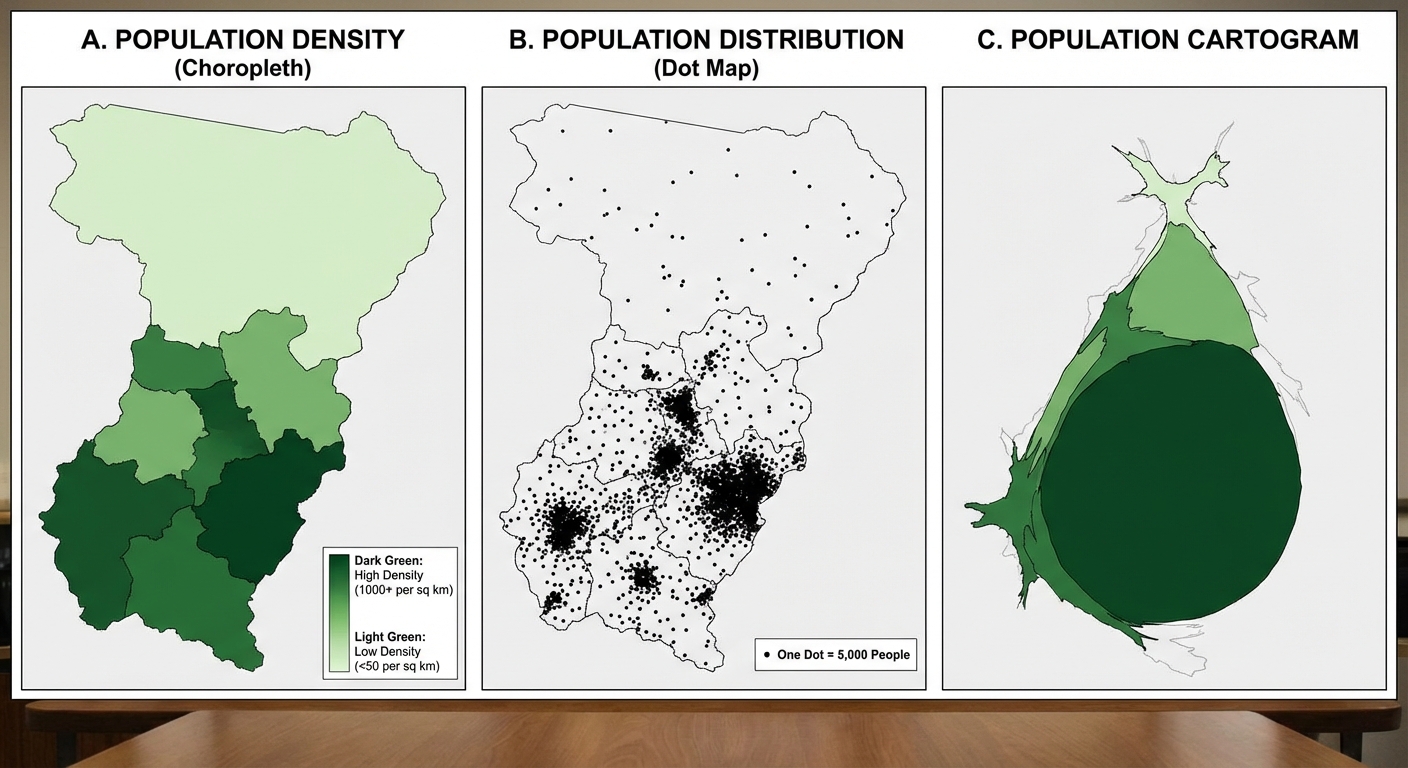
- Thematic Maps: Spatial narratives that display specific data or spatial patterns.
| Map Type | Description | Best Used For |
|---|---|---|
| Choropleth | Uses different shades or colors to represent values. | Showing density or percentage (e.g., Population density by state). |
| Dot Distribution | Uses dots to represent a specific value or event. | Visualizing spatial distribution and clustering. |
| Graduated Symbol | Uses symbols (usually circles) of different sizes to represent numerical values. | Comparing magnitude (e.g., Earthquakes by magnitude). |
| Isoline | Connects points of equal value with lines. | Weather (temperature/pressure) or Elevation (Topographic maps). |
| Cartogram | Distorts the size of land area to show the value of a specific variable. | Emphasizing inequality (e.g., World population size). |
Map Projections and Distortion
Because Earth is a sphere (geoid) and maps are flat, every map has distortion. It is mathematically impossible to flatten a sphere without altering one of the following properties (Remember S.A.D.D.):
- Shape
- Area
- Distance
- Direction
Common Projections
- Mercator Projection: Preserves direction (great for marine navigation) but drastically distorts area near the poles (Greenland looks huge).
- Peters Projection: Preserves area (land masses are correct relative size) but distorts shape (continents look stretched).
- Robinson Projection: A compromise projection. It distorts all four properties (S.A.D.D.) slightly to create a visually appealing map. Used often in classrooms.
The Concept of Scale
Scale is often the most confusing topic for students because the word represents two different concepts in AP Human Geography.
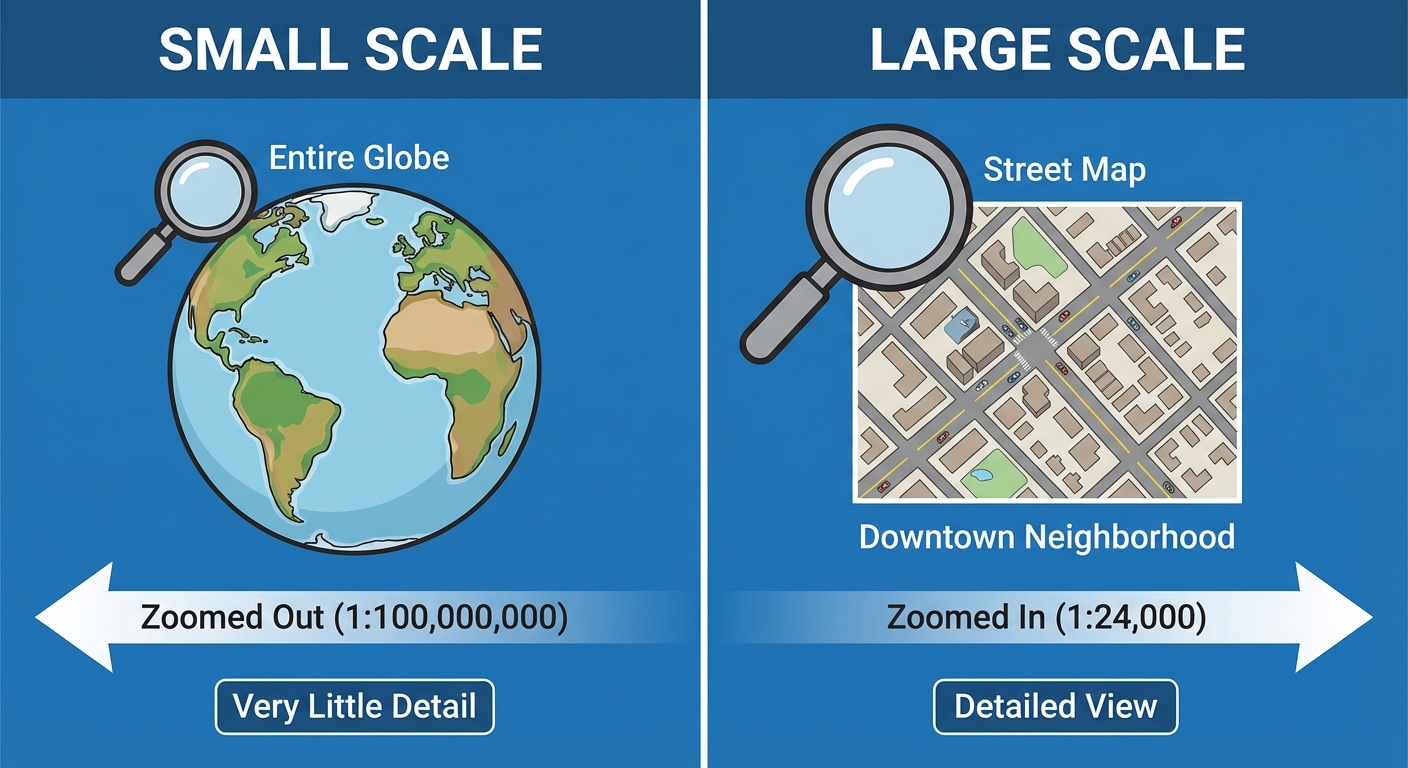
- Map Scale (Cartographic Scale): The relationship between the size of an object on a map and its actual size on Earth.
- Small Scale Map: Shows a large area with less detail (e.g., World Map). The fraction is small (1/100,000,000).
- Large Scale Map: Shows a small area with more detail (e.g., a subway map). The fraction is large (1/10,000).
- Scale of Analysis: The level at which data is aggregated and analyzed (Global, Regional, National, Subnational/Local). Changing the scale of analysis can change the patterns you see.
Geographic Data: Quantitative and Qualitative
Geographers rely on data to draw conclusions. This data usually comes from census work, fieldwork, or technology.
Data Categories
- Quantitative Data: Defines conditions using numbers and hard statistics. It answers questions like "How many?" or "How much?"
- Examples: Census data, income levels, birth rates, climate statistics.
- Qualitative Data: Describes the quality or character of a place. It is subjective and answers questions like "How does it feel to be there?" or "Why do people gather here?"
- Examples: Interviews, travel narratives, photographs, landscape descriptions, media reports.
Geospatial Technology
Modern geography relies heavily on the "Big Three" technologies.
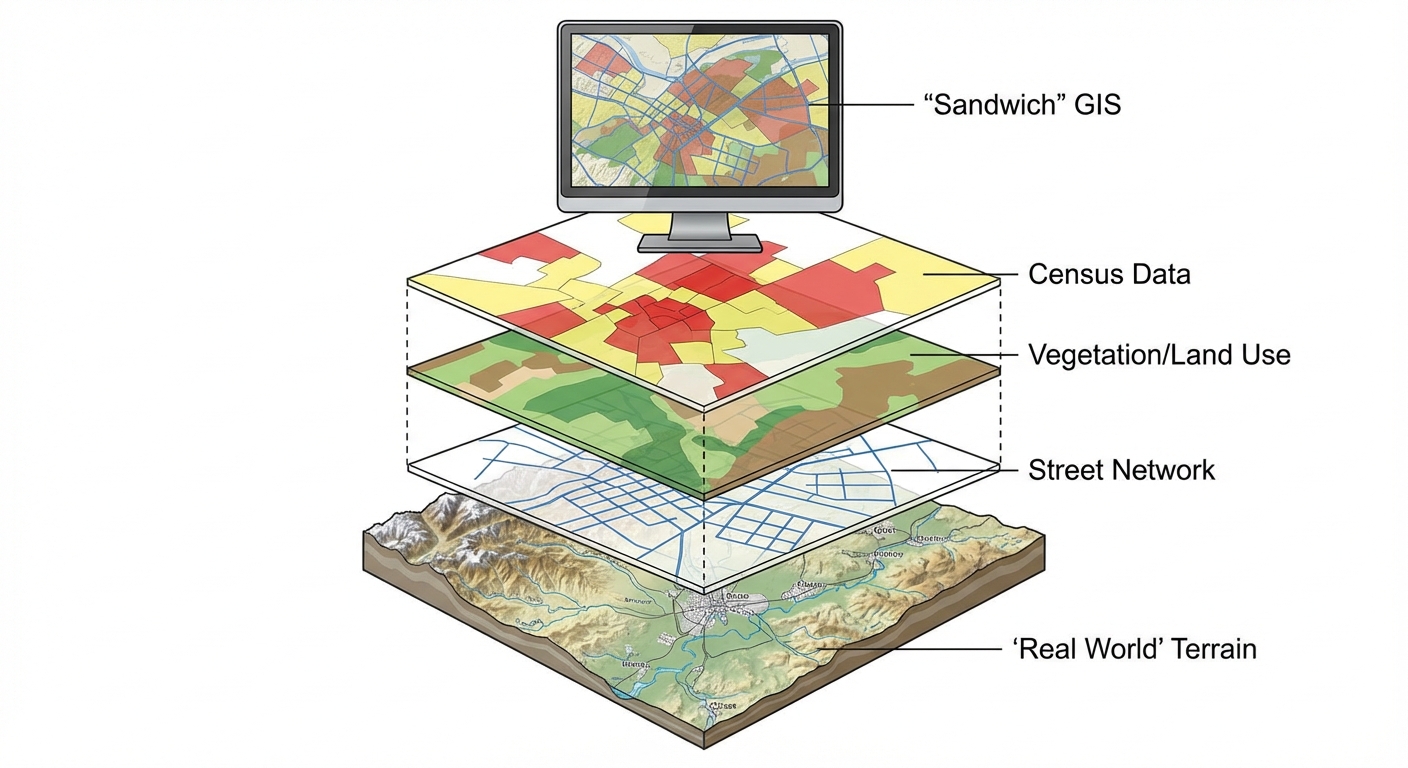
1. GIS (Geographic Information Systems)
Existing data is layered onto a map to analyze spatial relationships. Think of it as a "spatial sandwich."
- Function: Captures, stores, queries, and displays geographic data.
- Use Case: An urban planner layering a map of roads, a map of flood zones, and a map of population density to decide where to build a new hospital.
2. Satellite Navigation Systems (e.g., GPS)
Uses satellites to determine the precise absolute location of something on Earth.
- Function: Navigation and real-time location tracking.
- Use Case: Uber drivers finding a route; tracking shipping containers; geocaching.
3. Remote Sensing
The acquisition of data about Earth's surface from a satellite orbiting the planet or other long-distance methods (drones/aircraft).
- Function: Scanning the earth without making physical contact.
- Use Case: Monitoring deforestation in the Amazon, tracking hurricane movement, analyzing urban sprawl over decades.
The Power of Geographic Data
Data is not neutral; it is powerful. How it is collected, visualized, and analyzed shapes decision-making in government and business.
Practical Applications
- Government: Uses census data (redistricting) to determine representation in government and allocation of funding for schools and infrastructure.
- Business: uses Location Theory. A Starbucks isn't placed randomly; they utilize GIS to analyze traffic patterns, average income, and nearby competitors to maximize profit.
The "Modifiable Areal Unit Problem" (MAUP)
This occurs when data is grouped in different ways, leading to different results. For example, a state might vote "Red" overall (National scale), but the individual cities voted "Blue" (Local scale). If you only look at the state level (small scale), you miss the nuance of the local level.
Common Mistakes and Pitfalls
- Maps Scale Reversal:
- Mistake: Thinking a "Large Scale" map shows a large area (like the world).
- Correction: Remember Large Scale = Large Detail (Zoomed In). Small Scale = Small Detail (Zoomed Out).
- GIS vs. GPS:
- Mistake: Using the terms interchangeably.
- Correction: GPS gives you a dot on the map (location). GIS analyzes layers of data (analysis). If the question involves finding a route, it's GPS. If it involves analyzing relationships between variables, it's GIS.
- Projection Confusion:
- Mistake: Thinking the Mercator projection is "wrong."
- Correction: It is not wrong; it is just specific to navigation. Every projection has a specific use case and a specific distortion.
- Reference vs. Thematic:
- Mistake: Thinking a map showing highways is always a reference map.
- Correction: If the map highlights traffic density on those highways using colors, it has become a Thematic Map (specifically, flow-line or choropleth elements) because it is telling a data story, not just showing location.