Unit 2: Measuring Economic Performance and Output
The Circular Flow and GDP
To understand macroeconomics, we first need a model that illustrates how an economy is organized. The Circular Flow Model is a diagram that shows the flow of money, resources, goods, and services between different economic sectors.
The Simple Circular Flow Model
In its simplest form (a private, closed economy), the model consists of two main actors and two main markets:
- Households: They own the factors of production (land, labor, capital) and consume goods and services.
- Firms: They produce goods and services and buy resources to produce them.
- The Resource (Factor) Market: Where households sell resources (mostly labor) to firms.
- The Product Market: Where firms sell finished goods and services to households.

There are two distinct flows occurring simultaneously in opposite directions:
- Real Flow: The physical movement of resources (labor) from households to firms, and goods from firms to households.
- Monetary Flow: The movement of money. Firms pay wages, rent, interest, and profit to households (Income). Households pay for goods and services (Expenditure).
Defining Gross Domestic Product (GDP)
Gross Domestic Product (GDP) is the primary measure of an economy's output. It is defined as:
The market value of all final goods and services produced within a country during a specific time period (usually a year).
Key aspects of this definition:
- Market Value: We use dollars (prices) to aggregate apples and oranges into a single number.
- Final Goods: Only goods sold to the end user. We categorize goods as intermediate or final to avoid double counting.
- Within a Country: Production must happen inside the borders (e.g., a Honda factory in Ohio counts toward US GDP).
Calculating GDP: The Expenditure Approach
While GDP can be calculated via income or value-added, the standard method for AP Macroeconomics is the Expenditure Approach. This sums up all spending on final goods and services.
The formula is:
Where:
- $C$ (Consumption): Spending by households. This is the largest component (approx. 70% in the US). It includes:
- Durable goods (cars, appliances)
- Non-durable goods (food, clothes)
- Services (healthcare, education)
- $I$ (Gross Private Domestic Investment): Spending by businesses. It includes:
- Machinery, tools, and factories (capital stock)
- New residential housing (construction)
- Changes in inventory (unsold goods produced that year)
- $G$ (Government Spending): Spending by the public sector on goods and services (e.g., tanks, schools, police salaries).
- $N_x$ (Net Exports): Exports ($X$) minus Imports ($M$).
Limitations of GDP
While GDP is a useful indicator of economic activity, it is not a perfect measure of social welfare or standard of living. You must understand what is excluded from calculation and the qualitative shortcomings of the metric.
What is NOT Included in GDP?
To accurately measure production, economists exclude certain financial flows and transactions.
- Intermediate Goods: Goods used to make other goods (e.g., the tires on a new car). We exclude these to prevent double counting.
- Non-Production Transactions: Financial exchanges that do not generate new output.
- Used Goods: Selling a 2010 Toyota does not produce a new car.
- Financial Assets: Buying stocks or bonds is a transfer of ownership, not production.
- Transfer Payments: Government payments where no good/service is received in return (e.g., Social Security, welfare, scholarships).
- Non-Market Activities: Productive work done freely (e.g., household chores, childcare by parents, DIY home repairs).
- The Underground Economy: Illegal activities (black markets) or unreported cash tips.
Qualitative Limitations
Even if calculated perfectly, GDP falls short as a measure of happiness or well-being because it ignores:
- Leisure Time: A country with 80-hour work weeks might have high GDP but low quality of life.
- Income Inequality: High GDP per capita does not mean the average citizen is wealthy if the money is concentrated at the top.
- Environmental Costs: GDP treats pollution-generating production as a positive, ignoring the negative externalities (e.g., oil spills create cleanup jobs, which increase GDP, despite the damage).
- Product Quality: It is difficult for GDP to capture improvements in technology (e.g., a smartphone today is better than one from 2007, even if the price is similar).
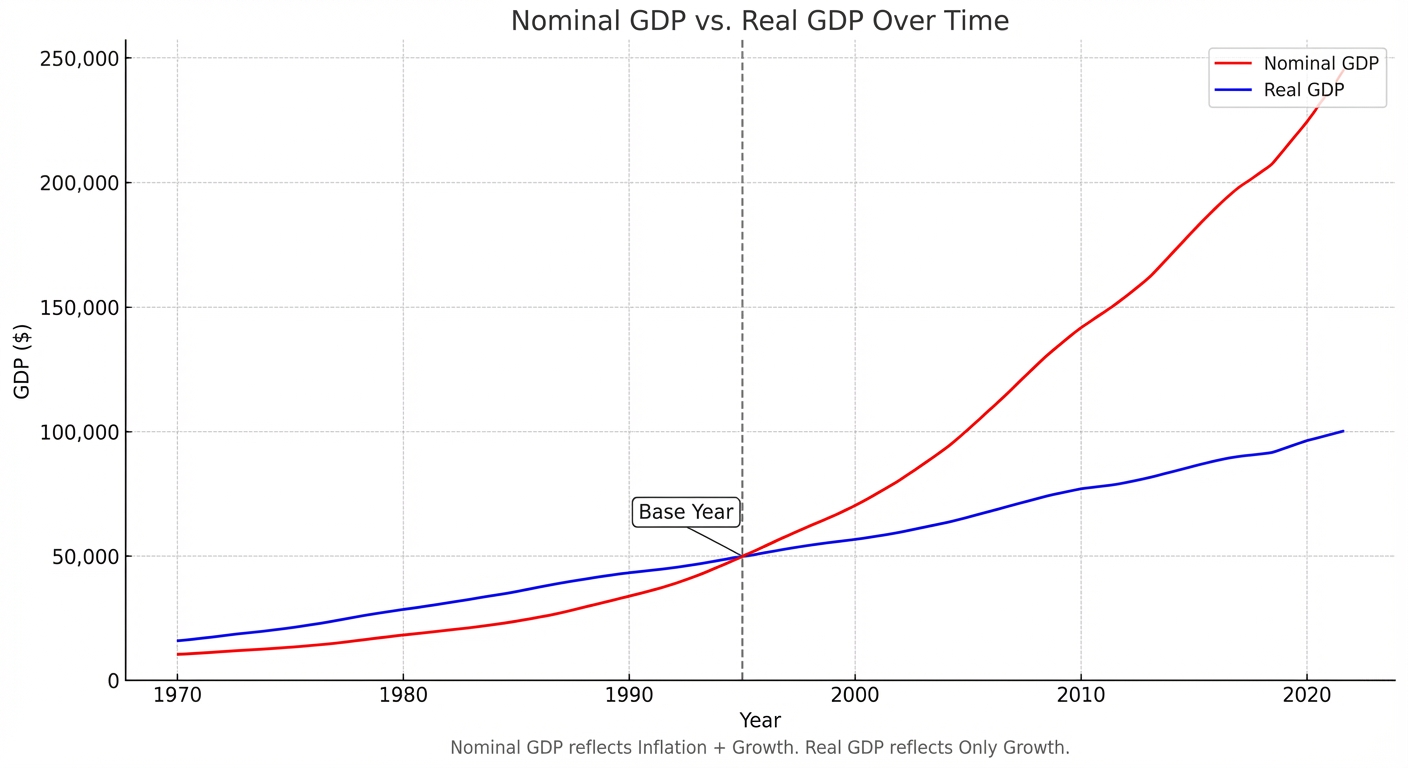
Real vs. Nominal GDP
Comparing GDP across years is tricky because prices change (inflation). If GDP goes up, did we produce more stuff, or did prices just get higher? To answer this, we distinguish between Nominal and Real GDP.
Definitions
- Nominal GDP: The value of current production at current prices. It is not adjusted for inflation.
- Real GDP: The value of current production at constant (base year) prices. It is adjusted for inflation. This is the better measure of actual economic growth.
Formulas
1. Calculating Nominal GDP
2. Calculating Real GDP
3. The GDP Deflator
The GDP deflator is an index that measures the average level of prices for all goods/services in GDP.
4. Calculating Real GDP using the Deflator
If you are given Nominal GDP and the Deflator, you can transpose the formula:
Economic Growth Rate
Economists measure the speed of economic growth by looking at the logical percentage change in Real GDP from one year to the next.
Common Mistakes & Pitfalls
- Confusing "Investment" with Financial Trading: In normal conversation, buying stocks is "investing." In economics, Investment ($I$) refers strictly to businesses buying physical capital (machines/factories), new housing construction, or inventory accumulation. Buying Amazon stock is distinct; that is a financial transfer, not economic investment.
- Transfer Payments: Students often mistakenly include Social Security or Unemployment checks in $G$ (Government Spending). These are Transfer Payments and are excluded from GDP because the government gets no good or service in return.
- The Intermediate Goods Trap: If a problem says "A baker buys flour," that flour is an intermediate good (excluded). If it says "You buy flour to bake a cake at home," that flour is a final good (included in $C$). Context matters.
- Nominal vs. Real: Remember, if Nominal GDP increases, we know nothing about output. Only an increase in Real GDP confirms that the economy produced more goods and services.