Comprehensive Guide to Urban Geography
Origins, Systems, and Models of Urbanization
This unit explores how cities form, how they are organized internally, and how they interact with one another in a global system. It covers historical origins, urban hierarchy, theoretical models, and contemporary struggles regarding sustainability and equity.
1. Urban Origins and Classification
Site vs. Situation
Understanding why cities are located where they are is fundamental to urban geography. This involves two distinct concepts:
- Site: The absolute location and physical characteristics of a place. Factors include terrain, soil, climate, and water sources.
- Example: New York City is located on a deep-water harbor with bedrock suitable for skyscrapers.
- Example: New Orleans has a poor site (below sea level, prone to flooding).
- Situation: The relative location of a place in relation to the surrounding physical and cultural features, largely determining its connectivity and importance.
- Example: New York City has an excellent situation because the Erie Canal/Hudson River linked it to the resource-rich interior of the Midwest.
- Example: Singapore is an Entrepôt (a break-of-bulk point where goods are transferred) situated along a vital global shipping lane.
Historical Transportation Epochs (Borchert's Model)
John Borchert (1967) analyzed American urbanization based on transportation technology. As transport changed, the shape and size of cities changed.
- Sail-Wagon Epoch (1790–1830): Cities were coastal ports; travel was slow and water-based.
- Iron Horse Epoch (1830–1870): Early steam trains allowed growth along rail lines; arrival of steamboats.
- Steel Rail Epoch (1870–1920): Transcontinental railways; industrialization; steel allowed for skyscrapers.
- Auto-Air-Amenity Epoch (1920–1970): Cars led to suburbanization; highways expanded the urban footprint.
- High-Technology Epoch (1970–Present): Satellite cities and telecommuting.
Classifying Cities
- Megacities: Metropolitan areas with over 10 million people (e.g., Tokyo, Delhi, Mexico City). These are increasingly common in the Semi-Periphery.
- Metacities: Massive urban regions with over 20 million people (e.g., Tokyo).
- World Cities (Global Cities): Centers of economic, cultural, and political activity that are globally influential. They drive the global economy (e.g., London, New York, Tokyo).
2. Urban Hierarchies and Systems
How do cities interact? Geographers use mathematical models to predict city size and interaction.
The Rank-Size Rule vs. Primate Cities
1. Rank-Size Rule
Common in developed nations (like the US, Canada, Germany), this rule suggests a regular pattern in the size of cities.
- Formula: The $n$-th largest city is $\frac{1}{n}$ the size of the largest city.
- Example: If City A has 1,000,000 people, City B (2nd largest) has 500,000, and City C (3rd largest) has 333,333.
- Implication: Indicates reliable infrastructure, evenly distributed wealth, and services throughout the country.
2. Primate City Rule
A system where the largest city is disproportionately larger (more than twice the size) than the second-largest city.
- Example: London (UK), Mexico City (Mexico), Bangkok (Thailand).
- Implication: Often indicates uneven development. Services, wealth, and power are concentrated in the primate city, leaving rural areas underserved.
Gravity Model
Based on Newton’s law of gravity, this model predicts the likelihood of interaction (trade, migration) between two places.
- Formula:
- Concept: Large cities interact more with other large cities, even if they are far apart (like NYC and London). Interaction decreases as distance increases (Distance Decay).
Central Place Theory (Christaller)
Developed by Walter Christaller (1933) to explain the distribution of services. He visualized market areas as hexagons to prevent gaps or overlaps.
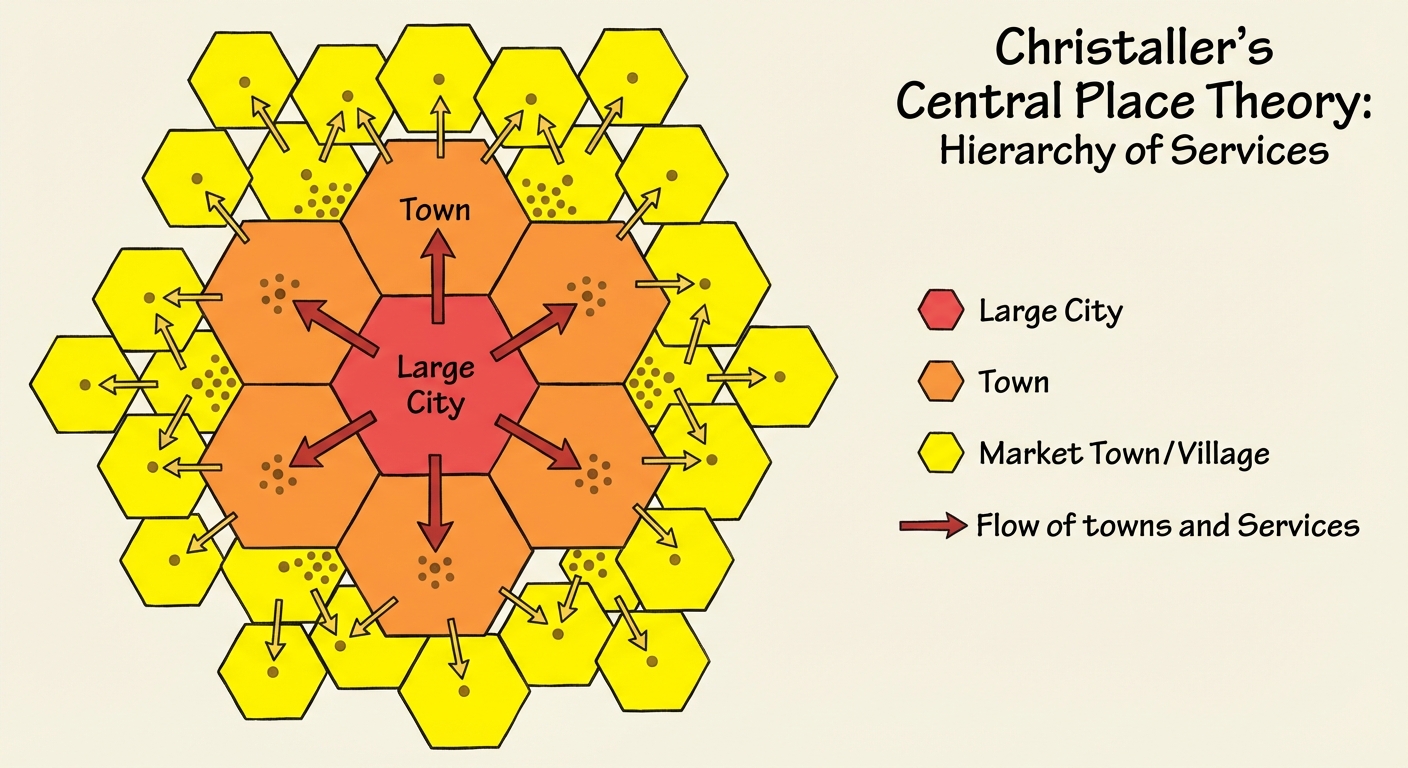
Key Concepts:
- Central Place: A market center for the exchange of services.
- Range: The maximum distance a consumer is willing to travel for a specific service (short for milk, long for heart surgery).
- Threshold: The minimum number of people needed to support a business (low for a gas station, high for a pro sports team).
The Hierarchy:
- Hamlet: Fewest services (gas station, general store).
- Village
- Town
- City: Highest order services (hospitals, universities).
3. Internal Structure of Cities (North American Models)
These models attempt to explain the spatial arrangement of people and businesses in US/Canadian cities.
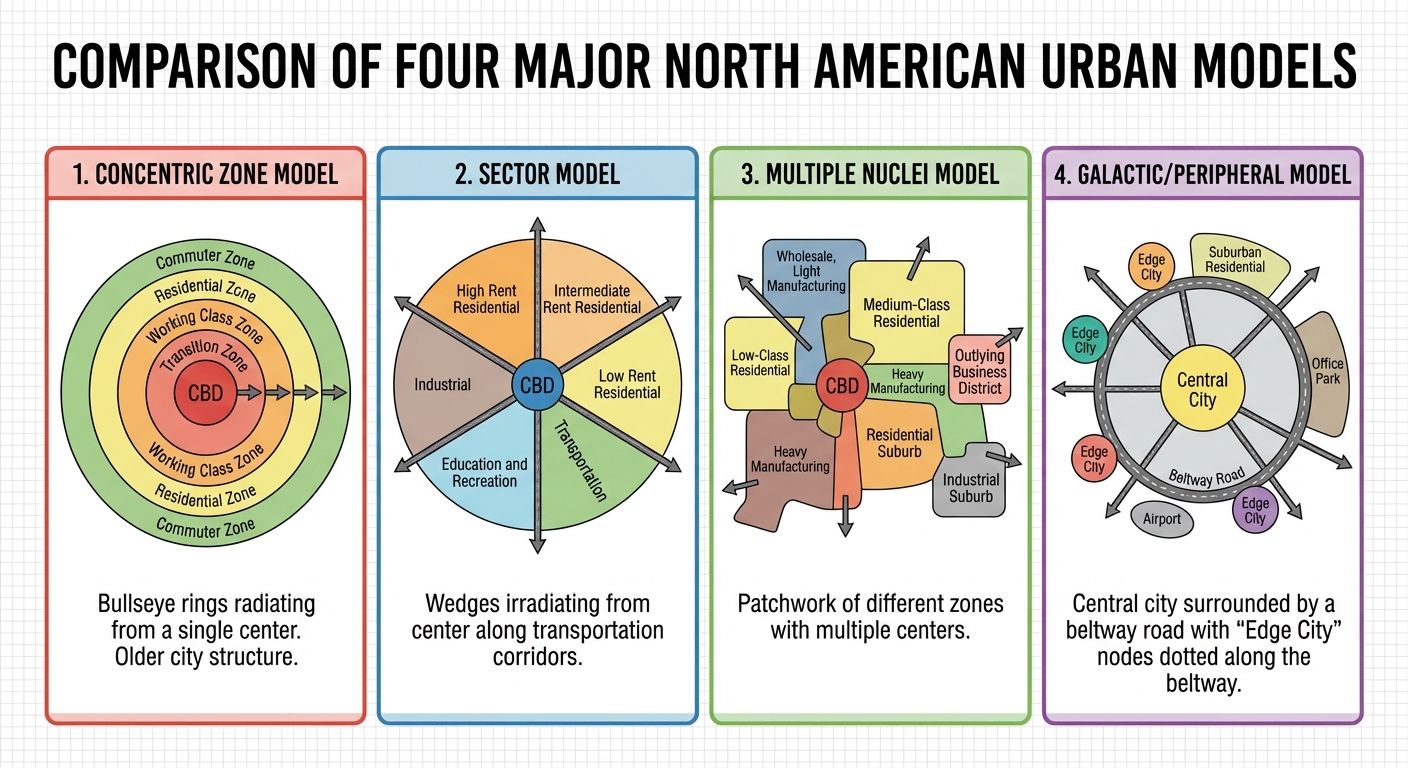
Concentric Zone Model (Burgess, 1923)
Based on Bid-Rent Theory (land cost decreases as you move away from the center). Modeled after 1920s Chicago.
- Central Business District (CBD): Peak land value.
- Zone of Transition: Industry and low-quality housing (immigrants/low income).
- Working-Class Homes: Older, modest homes.
- Better Residences: Middle-class.
- Commuter Zone: Suburbs.
Sector Model (Hoyt, 1939)
Cities develop in wedges or sectors, not rings, primarily along transportation corridors (rail lines, highways).
- Industrial zones align with railroads.
- High-income housing grows outward from the CBD in a specific wedge away from industry.
Multiple Nuclei Model (Harris & Ullman, 1945)
Cities do not have a single center but multiple nodes of activity.
- University nodes, hospital nodes, and airport nodes attract specific services.
- Compatible land uses cluster (hotels near airports); incompatible uses repel (homes away from heavy industry).
Galactic City (Peripheral) Model (Harris, 1960s)
Represents the post-industrial, prevalent US city today.
- Decentralization of the CBD.
- Beltway: A ring road surrounds the city.
- Edge Cities: Autonomous nodes of economic activity on the beltway. To be an Edge City, a place must:
- Have >5 million sq. ft. of office space.
- Have >600k sq. ft. of retail.
- Have more jobs than bedrooms (commuter destination).
- Example: Tysons Corner, Virginia.
4. Cities of the World (Global Models)
Cities outside North America follow different patterns due to colonialism, culture, and history.
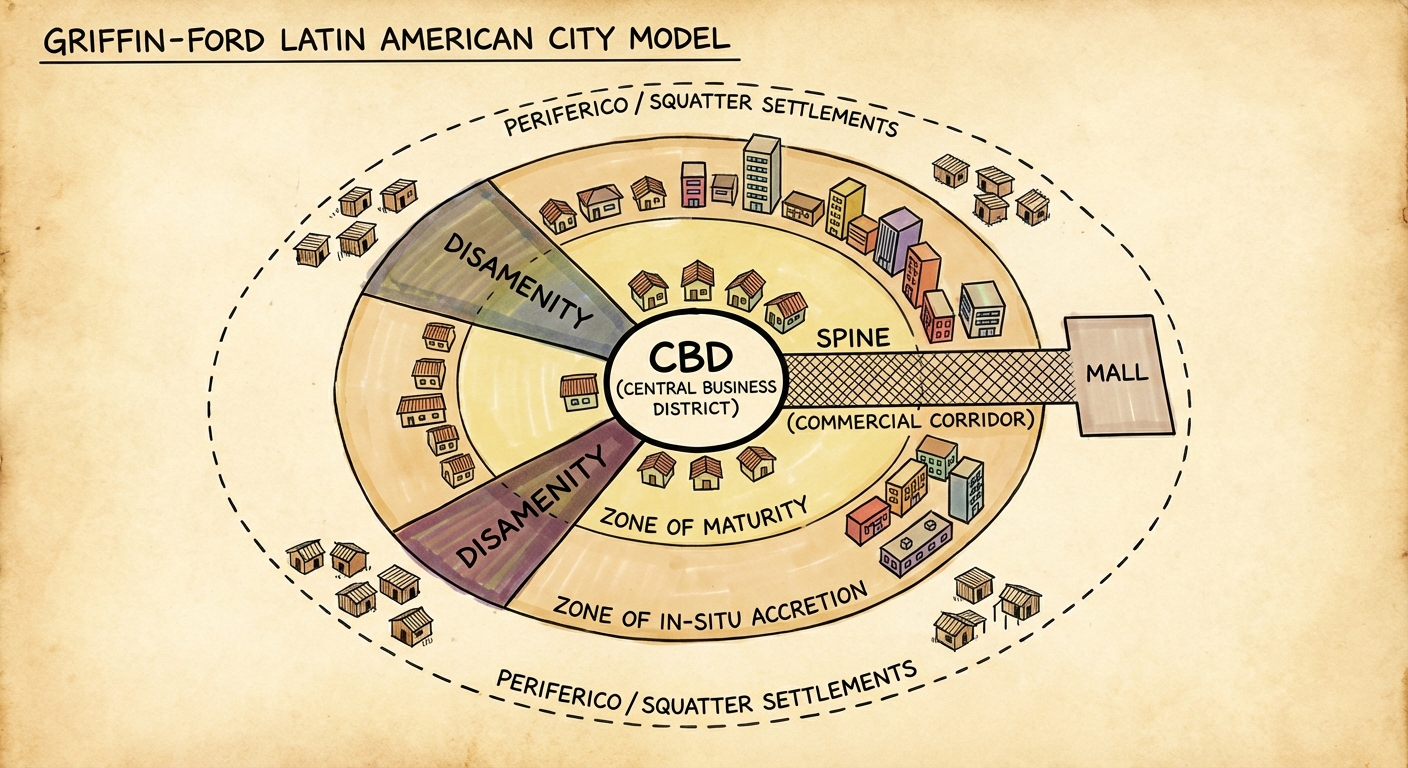
Latin American City Model (Griffin-Ford)
- Spine: A high-end commercial strip extending from the CBD, surrounded by elite residential housing.
- Mall: High-end retail at the end of the spine.
- Periferico: The outer ring characterized by poverty.
- Favelas/Barrios (Squatter Settlements): Located on the outskirts; land often not owned by residents; lacks infrastructure.
- Disamenity Zones: Areas controlled by gangs or drug lords, often on difficult terrain (slopes).
- Laws of the Indies: Colonial laws that mandated a grid pattern with a central plaza and church.
Southeast Asian City Model (McGee)
- No formal CBD: The focus is the Old Colonial Port Zone.
- Alien Commercial Zones: Areas dominated by Chinese merchants.
- Western Commercial Zone: Western businesses/offices.
Sub-Saharan African City Model (De Blij)
Characterized by three distinct CBDs:
- Colonial CBD: Vertical development, grid pattern (European influence).
- Traditional CBD: Single-story, irregular commerce.
- Market Zone: Open-air, informal/curbside commerce.
- Surrounded by ethnic neighborhoods and mining/manufacturing zones.
5. Urban Trends and Land Use Issues
Suburbanization and Sprawl
- Suburbanization: Movement from inner cities to the fringe. Accelerated after WWII due to the G.I. Bill (loans), interstate highways, and mass-produced housing (Levittown).
- Urban Sprawl: Unrestricted growth of housing, commercial development, and roads over large expanses of land, with little concern for urban planning.
- Boomburbs: Rapidly growing suburban cities with a population >100,000. They are not bedroom communities but have their own economies (e.g., Irvine, CA; Plano, TX).
- Exurbs: Prosperous residential districts beyond the suburbs (commuter zone), often for people working from home or seeking access to nature.
Segregation and Social Challenges
Historical housing policies have created lasting segregation in US cities.
- Redlining: Banks refused loans to people in certain "risky" neighborhoods (often Black communities), marked in red on maps. This prevented wealth accumulation.
- Blockbusting: Real estate agents played on racial fears, convincing White owners to sell low ("White Flight") and reselling to minorities at a markup.
- Racial Steering: Directing buyers to specific neighborhoods based on race.
- Environmental Injustice: Low-income/minority areas are often located near pollution sources (factories, dumps) or heat islands.
Gentrification vs. Deterioration
- Filtering: The process of large houses being subdivided for lower-income families, eventually leading to abandonment.
- Gentrification: The process of converting an urban neighborhood from a predominantly low-income, renter-occupied area to a predominantly middle/upper-class, owner-occupied area.
- Pros: Improved tax base, safer neighborhoods, building restoration.
- Cons: Displacement of original residents, loss of cultural character, rising rents.
Squatter Settlements (Global South)
Also known as shantytowns, favelas, or bustees. Arise due to rapid urbanization where housing supply cannot meet demand.
- Located on the periphery or disamenity zones (steep slopes).
- Informal Economy: untaxed, unregulated business is common.
- Land Tenure: Residents lack legal title to the land.
6. Sustainable Urban Planning
New Urbanism & Smart Growth
Reactive movements against urban sprawl.
- New Urbanism: A planning philosophy focusing on:
- Walkability: Amenities within a 5-minute walk.
- Mixed-Use Development: Residential (apartments) on top of Commercial (shops) in the same building.
- Connectivity: Grid streets to diffuse traffic.
- Smart Growth: Legislation and regulations to limit suburban sprawl and preserve farmland (e.g., growth boundaries).
- Greenbelts: Rings of open space/parks around a city where construction is restricted (common in UK).
Brownfields vs. Greyfields
- Brownfield: Abandoned industrial sites with presence of hazardous contaminants. Remediation allows them to be redeveloped (e.g., turning an old factory into lofts).
- Greyfield: Failing commercial land, like dead malls, with vast asphalt parking lots.
Quantitative vs Qualitative Data
- Quantitative: Census data, employment stats, crime rates. Used to determine redistricting and funding.
- Qualitative: Narrative data, surveys, field observations. Used to understand the "feel" or opinion of a neighborhood.
7. Common Mistakes & Pitfalls
- Trend vs. Model: Students often confuse models (theoretical diagrams like Burgess) with actual current trends. Remember models are simplifications of a specific time period.
- Megacity vs. World City: A Megacity is defined by population size (>10M). A World City is defined by power and influence. Lagos, Nigeria is a Megacity but not a top-tier World City. Zurich is a World City (financial hub) but not a Megacity.
- Primate City Misconception: Not every country has a primate city. If the second city is close in size to the first (e.g., Brazil: Sao Paulo & Rio), it follows Rank-Size, not Primacy.
- Site vs. Situation:
- Correct: The island is muddy (Site). The island is near a trade route (Situation).
- Incorrect: The site is good for trade.
- Latin American Model: Do not confuse the "Spine" (wealthy) with the "Disamenity Sector" (poor/gang-controlled). They are usually opposite or distinct features.