Unit 1: Fundamentals of Economic Analysis
Unit 1: Fundamentals of Economic Analysis
Scarcity and the Factors of Production
At the heart of all economic theory lies a single, inescapable truth: we cannot have everything we want. This leads us to the foundational definition of the subject.
Economics is the social science concerned with the efficient use of scarce resources to achieve maximum satisfaction of economic wants.
The Economic Problem: Scarcity
Scarcity exists because society has unlimited wants but limited resources. Scarcity is not the same as poverty; even the richest individuals and nations face scarcity because time and resources are finite.
Because of scarcity, we must make choices. Every choice involves a trade-off (giving up one thing to get another).
The Factors of Production (Resource Categories)
To produce goods and services, economists categorize resources into four groups, often remembered by the mnemonic CELL:
- Land: All natural resources used in production (e.g., water, oil, sun, animals, vegetables, minerals).
- Labor: The physical and mental effort used to produce goods and services.
- Capital:
- Physical Capital: Human-made resources used to create other goods (e.g., hammers, tractors, factories, robots).
- Crucial Distinction: Human Capital refers to the skills or knowledge gained by a worker through education and experience.
- Entrepreneurship: The skill of people who combine land, labor, and capital to create new goods and services. They take risks to obtain a profit.
Important Note: In AP Macroeconomics, money is NOT capital. Money facilitates trade, but it is not a productive resource itself (you cannot hammer a nail with a dollar bill).
Opportunity Cost
Since resources are scarce, every decision incurs a cost.
Opportunity Cost is the value of the next best alternative given up when a choice is made. It is not the sum of all alternatives, just the single most desirable one you did not choose.
TINSTAAFL
This acronym stands for "There Is No Such Thing As A Free Lunch." Even if a lunch is strictly "free" in terms of money, there is an opportunity cost (your time could have been spent working, sleeping, or studying).
Calculated Example
Suppose you have two hours. You can either study for an exam (estimated value: an A grade) or go to the movies (estimated value: enjoyment). If you choose the movies, the opportunity cost is the A grade you sacrificed.
The Production Possibilities Curve (PPC)
The Production Possibilities Curve (sometimes called the Frontier or PPF) is a graphical model that shows the alternative combinations of two goods that an economy can produce, assuming:
- All resources are fully employed.
- Resources are fixed.
- Technology is fixed.
- Only two goods are being produced.
Interpreting the Graph
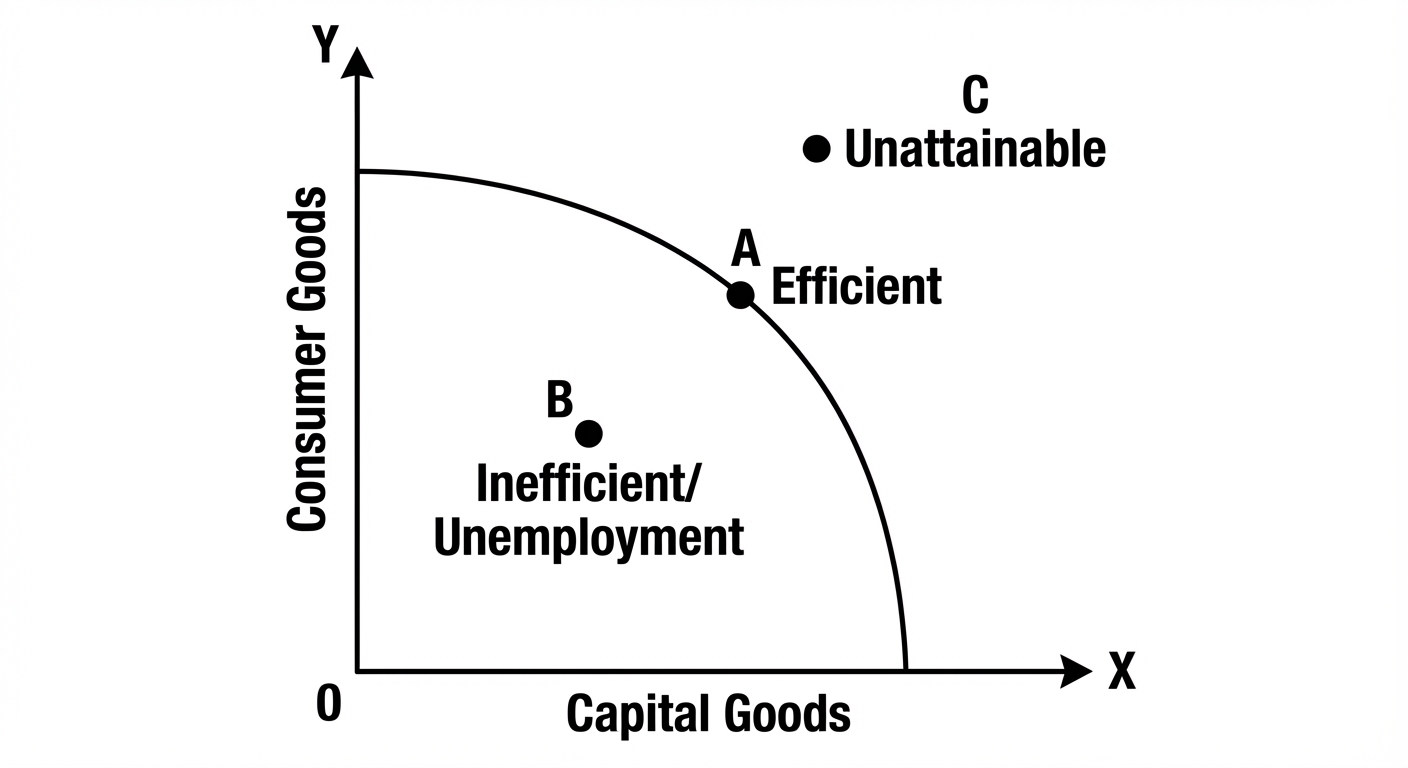
- Points on the curve: represent Efficient use of resources. The economy is operating at full potential.
- Points inside the curve: represent Inefficiency (or underutilization). Resources are idle (e.g., high unemployment).
- Points outside the curve: represent Unattainable production levels given current resources and technology.
Shape of the Curve: The Law of Increasing Opportunity Cost
The shape of the PPC tells us about the adaptability of resources.
- Straight Line PPC: Indicates Constant Opportunity Cost. This happens when resources are easily adaptable between the two goods (e.g., Pizza vs. Calzones).
- Bowed-Out Difference (Concave): Indicates Increasing Opportunity Cost. As you produce more of one good, the opportunity cost (what you give up of the other) increases.
- Why? Resources are not easily adaptable. If you shift from producing corn to producing computer chips, you eventually have to use land and farmers that are great at growing corn but terrible at making chips.

Shifting the PPC
The PPC represents a snapshot in time. It can shift (grow or shrink) based on three factors (often remembered as 3 Shifters):
- Change in Resource Quantity or Quality (e.g., more workers, better education, new oil deposits).
- Change in Technology (e.g., faster microchips, automation).
- Change in Trade (allows consumption outside the PPC, though not production).
Comparative Advantage and Trade
Trade generally benefits all parties involved. To understand why, we look at absolute and comparative advantages.
Definitions
- Absolute Advantage: The ability to produce more of a good/service with the same amount of resources (or the same amount in less time) than another producer.
- Comparative Advantage: The ability to produce a good/service at a lower opportunity cost than another producer.
The Rule of Trade: Countries should specialize in producing goods where they have a Comparative Advantage and trade for the rest. This allows total global output to increase.
Terms of Trade
For trade to be beneficial, the "price" (exchange rate) of the good must fall between the opportunity costs of the two trading partners.
Calculating Comparative Advantage
There are two types of problems you will encounter: Output problems (how much can be made?) and Input problems (how long/how many resources does it take?).
1. Output Method (The "OOO" Rule)
Data shows the number of goods produced with a fixed amount of resources.
- Mnemonic: Output? Other goes Over.
- Formula for Opportunity Cost of Good A:
Example Table:
| Country | Cars | Planes |
|---|---|---|
| USA | 50 | 10 |
| Japan | 40 | 5 |
- USA Opportunity Cost for 1 Plane:
- Japan Opportunity Cost for 1 Plane:
The USA has a lower opportunity cost (5 < 8), so the USA has the comparative advantage in Planes.
2. Input Method (The "IOU" Rule)
Data shows the resources (hours, acres, workers) required to produce ONE unit of a good.
- Mnemonic: Input? Other goes Under.
- Formula for Opportunity Cost of Good A:
Tip: In Input problems, the lower number represents the Absolute Advantage (since it takes less time/resource).
Common Mistakes & Pitfalls
1. Absolute vs. Comparative Advantage
- Mistake: Assuming the country with the absolute advantage should produce everything.
- Correction: Trade is based only on Comparative Advantage. Even if the USA is better at making everything than Vietnam, the USA should still trade because it frees up resources to focus on its most profitable output.
2. Money is NOT Capital
- Mistake: Listing "money" or "stocks" as factors of production.
- Correction: In economics, capital refers strictly to physical tools, machinery, and factories used for production.
3. Efficiency vs. Allocative Efficiency
- Mistake: Thinking any point on the PPC is equally desirable.
- Correction: Any point on the curve is productively efficient (no waste), but only one point is allocatively efficient (what society actually wants most).
4. Input vs. Output Math
- Mistake: Using the division incorrectly.
- Correction: Identify the problem type immediately.
- Does the number represent units produced? (Output -> Other Over).
- Does the number represent time/labor needed? (Input -> Other Under).
5. Unemployment vs. Shift
- Mistake: Shifting the PPC inward when unemployment rises.
- Correction: Unemployment is a point inside the curve. The ability to produce (the curve itself) hasn't changed; we just aren't using our resources.