Unit 2: The Living World - Biodiversity
2.1 Introduction to Biodiversity
Three Levels of Biodiversity
Biodiversity is not just a count of animals; it helps determine the stability and recovery potential of an ecosystem. It is categorized into three levels:
- Genetic Diversity: The measure of genetic variation among individuals in a population (e.g., difference in fur thickness in a population of wolves).
- Populations with high genetic diversity are more likely to survive environmental changes because some individuals are likely to possess traits that help them adapt.
- Species Diversity: The number of species in a region or in a particular type of habitat.
- Species Richness: The total number of different species.
- Species Evenness: The relative abundance of each species. (An ecosystem with 100 trees—99 oaks and 1 pine—has high richness but low evenness).
- Habilitat (Ecosystem) Diversity: The variety of habitats that exist within a given region.
- General rule: Loss of habitat diversity leads to a loss of specialist species, followed by a loss of generalist species.
The BottleNeck Effect
A crucial concept in Genetic Diversity is the Population Bottleneck.
- Definition: A sharp reduction in the size of a population due to environmental events (earthquakes, floods, fires) or human activities (genocide, hunting).
- Consequence: The visible population may recover in numbers, but the genetic diversity remains permanently reduced. This leads to inbreeding and higher vulnerability to disease.
- Example: The Cheetah population experienced a bottleneck ~10,000 years ago; today, they have very low genetic diversity.
Generalist vs. Specialist Species
How species utilize these habitats defines their classification:
- Generalist Species: Can live in many different places, eat a variety of foods, and tolerate a wide range of environmental conditions.
- Characteristics: Broad niche, high tolerance.
- Examples: Raccoons, Rats, Humans, Cockroaches.
- Specialist Species: May be able to live in only one type of habitat, eat only one or a few types of food, or tolerate a narrow range of climatic interactions.
- Characteristics: Narrow niche, low tolerance, prone to extinction.
- Examples: Giant Panda (eats bamboo), Koala (eats eucalyptus), Northern Spotted Owl (old-growth forests).
Biodiversity Metrics
Shannon-Wiener Index: A common formula used to quantify biodiversity, taking into account both richness and evenness. Higher values indicate higher diversity.
2.2 Ecosystem Services
Ecosystem services are the varied benefits that humans freely gain from the natural environment and from properly-functioning ecosystems. If these ecosystems break down, the economic cost to humans would be astronomical.
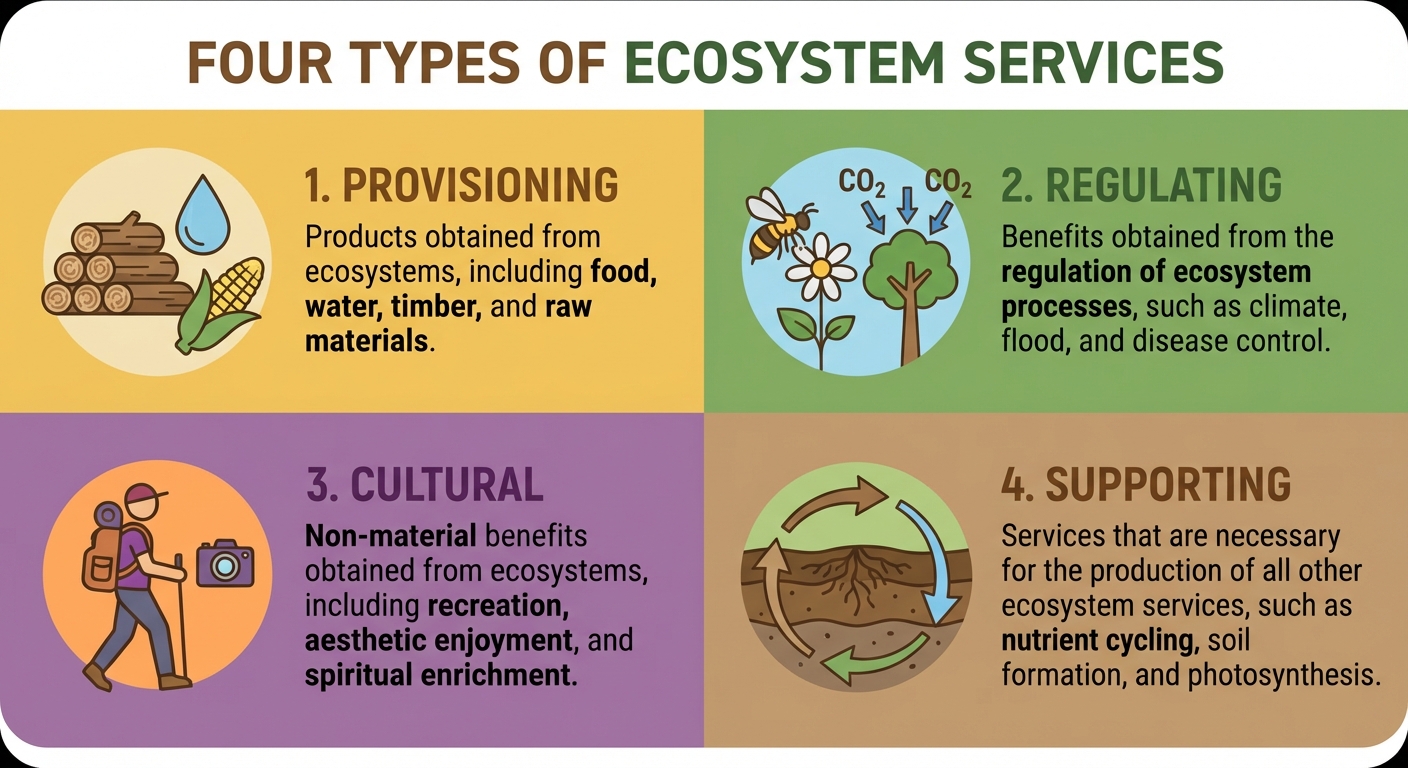
1. Provisioning Services
Physical products obtained from ecosystems.
- Examples: Lumber, fur, meat, crops, water, medicinal plants, rubber.
- Disruption: Overharvesting acts as a direct threat to these provisions.
2. Regulating Services
Benefits obtained from the regulation of ecosystem processes. These services keep natural systems in check.
- Examples:
- Plants removing CO$_2$ (Climate regulation).
- Trees filtering air pollutants.
- Wetlands filtering water (Water purification).
- Bees pollinating crops (Pollination).
3. Cultural Services
Non-material benefits people obtain from ecosystems.
- Examples: Tourism (ecotourism), aesthetic inspiration, recreation, spiritual experience.
4. Supporting Services
Services necessary for the production of all other ecosystem services. These usually happen over a long scale and we don't "use" them directly, but without them, the other three wouldn't exist.
- Examples:
- Photosynthesis (primary production).
- Nutrient cycling (Nitrogen/Phosphorous cycles).
- Soil formation.
2.3 Island Biogeography
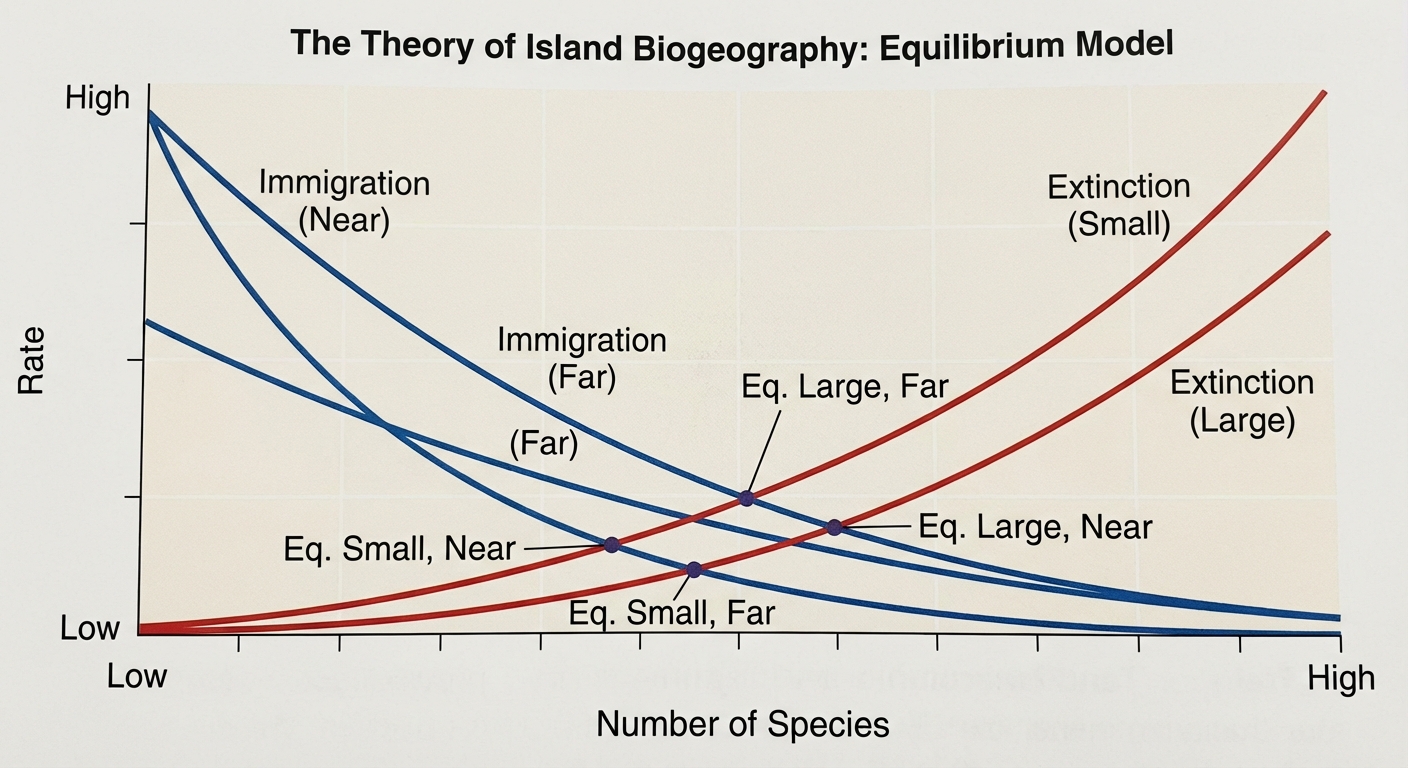
The Theory of Island Biogeography
Developed by MacArthur and Wilson, this theory deals with the study of the ecological relationships and distribution of organisms on islands, and of these organisms' community structures.
Note: An "island" isn't just land surrounded by water. It can be a mountain peak surrounded by desert (sky islands), or an oasis surrounded by sand, or a fragmented forest patch.
Two Main Factors
- Distance Effect (Distance from Mainland):
- Closer islands have higher immigration rates because it is easier for species to reach them.
- Farther islands have lower immigration rates.
- Size Effect (Area of the Island):
- Larger islands support more species (higher richness) because they have more available habitats and resources.
- Larger islands have lower extinction rates.
- Smaller islands have higher extinction rates due to limited resources and smaller populations.
Application to Conservation
This theory is critical when designing nature reserves. A single large reserve is generally better than several small reserves (SLOSS debate - Single Large or Several Small) because it supports larger populations and has less "edge effect."
2.4 Ecological Tolerance
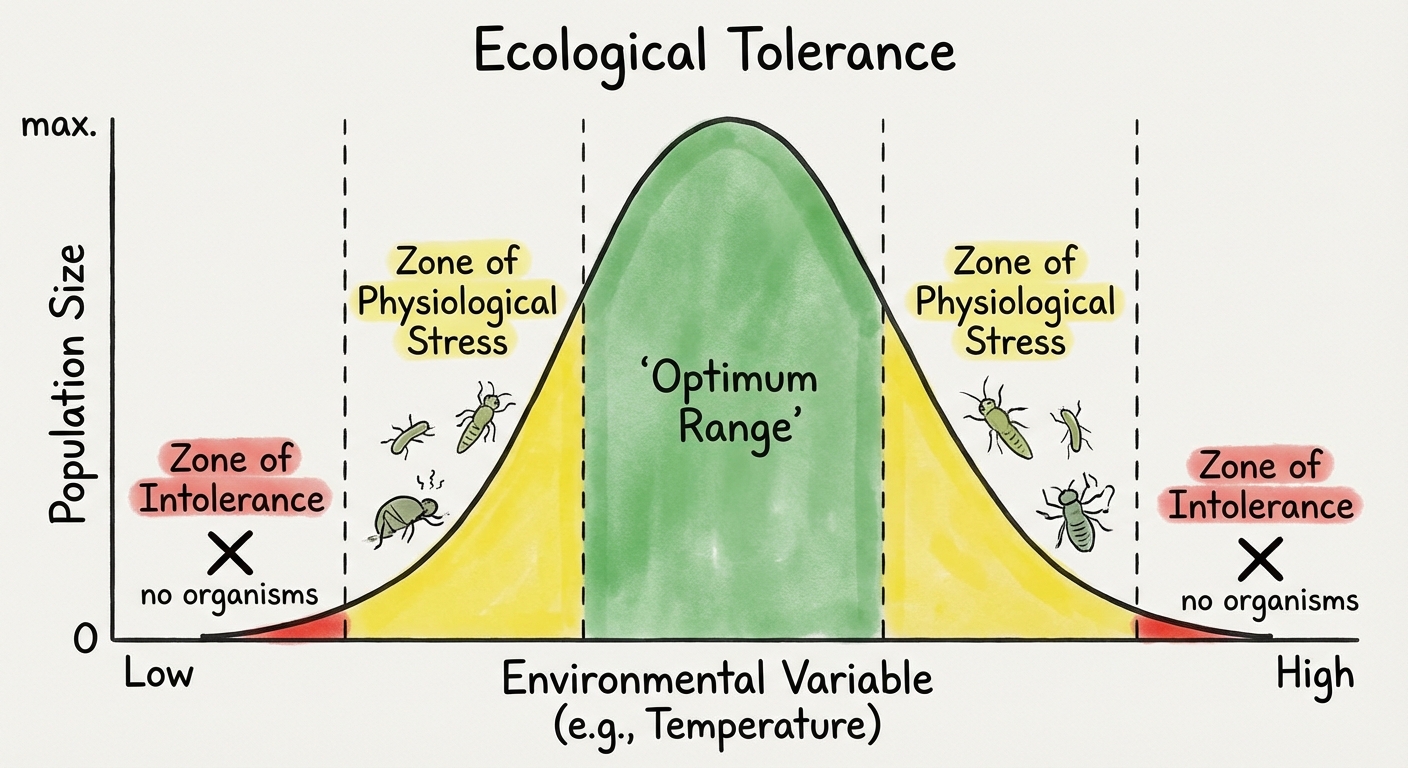
Range of Tolerance
Every species has a range of abiotic conditions it can tolerate. This is often visualized as a Bell Curve.
- Optimal Range: The range where the species survives, grows, and reproduces best.
- Zone of Physiological Stress: The organism survives but experiences stress (e.g., stunted growth, lower fertility). It occurs when conditions are slightly lower or higher than optimal.
- Zone of Intolerance: The organism dies. Conditions are too extreme (too hot/cold, too salty/fresh).
Limiting Factors
A Limiting Factor is an abiotic factor that is in shortest supply relative to the needs of the organism, preventing the population from growing larger.
- Terrestrial: Often Soil Nutrients (Nitrogen/Phosphorus), Water, or Temperature.
- Aquatic: Often Dissolved Oxygen (DO), Salinity, or Light.
2.5 Natural Disruptions to Ecosystems
Ecosystems change naturally over time; human impact is not the only driver of change.
Time Scales of Natural Change
- Periodic: Occurs at repeated, regular intervals (e.g., Tides, seasons).
- Episodic: Occurs occasionally and at irregular intervals (e.g., El Niño/La Niña cycles, hurricanes).
- Random: No specific pattern (e.g., Meteorite impacts, sudden volcanic eruptions).
Historical Context
- Climate Change: Earth's climate has oscillated between warm periods and ice ages for millennia due to Milankovitch Cycles (changes in Earth's orbit and tilt) and atmospheric composition.
- Sea Level: Sea levels have risen and fallen significantly over geological time as glacial ice melts (seas rise) or forms (seas fall).
Migration
Wildlife migration is a behavioral adaptation to natural disruptions.
- Reason: To find food, mates, or better climate conditions.
- Disruption: Habitat fragmentation (roads, fences) naturally disrupts these corridors.
2.6 Adaptations
Mechanism of Adaptation
Organisms do not "decide" to adapt.
- Genetic Variation: Exists in a population via mutation.
- Natural Selection: Environmental pressures (predators, climate) favor certain traits.
- Survival & Reproduction: Individuals with favorable traits survive and pass genes to the next generation.
Key Rule: The more genetically diverse a population is, the better it can respond to environmental stressors.
Example: Peppered Moths. Before the industrial revolution, light moths were common (camouflaged against lichen). Soot from factories killed lichen and darkened trees. Dark moths became more common (natural selection).
2.7 Ecological Succession
Ecological succession is the gradual process describing how the structure of a biological community changes over time.
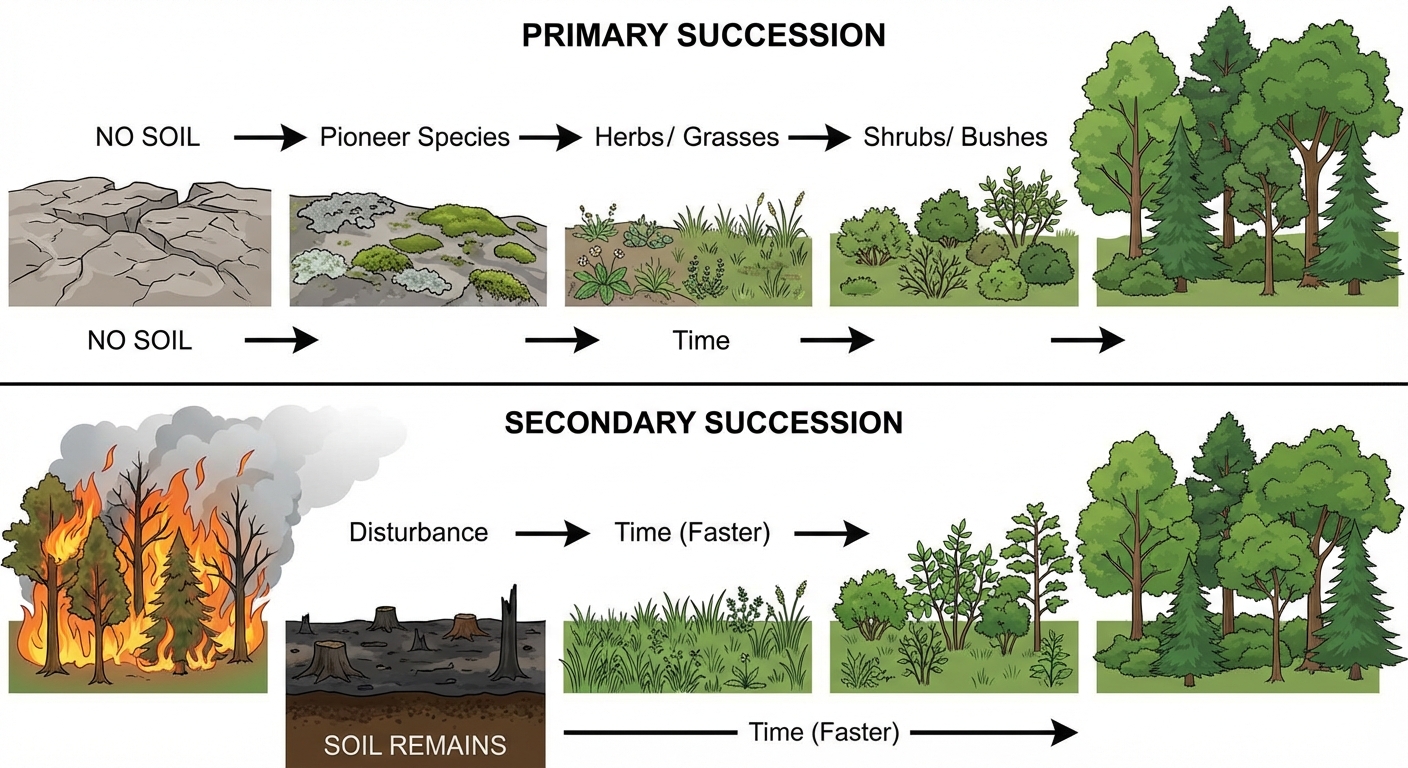
1. Primary Succession
Begins in a lifeless area with NO SOIL.
- Starting Point: Bare rock, cooled lava, retreating glacier.
- Pioneer Species: Lichens and mosses. They secrete acids that weather the rock, physically break it down, and die to create organic matter. This creates soil.
- Time scale: Hundreds to thousands of years.
2. Secondary Succession
Begins in an area where a disturbance has cleared the community but SOIL REMAINS.
- Starting Point: Forest fire, flood, abandoned farmland.
- Pioneer Species: Grasses, weeds, wildflowers (seeds often already present in soil).
- Time scale: Decades to a century (much faster than primary).
Keystone and Indicator Species
While applicable to the whole unit, these are most visible during ecosystem changes.
- Keystone Species: A species that has a disproportionately large effect on its environment relative to its abundance. if removed, the ecosystem changes drastically (often collapses).
- Example: Sea Otter (eats urchins; without them, urchins destroy kelp forests). Beavers (ecosystem engineers).
- Indicator Species: An organism whose presence, absence, or abundance reflects a specific environmental condition.
- Example: Amphibians (reflect water quality/pollution). E. coli (indicates fecal contamination).
Stages of Succession
- Pioneer Stages: Bare rock $\rightarrow$ Lichens/Mosses $\rightarrow$ Annual Herbs.
- Intermediate Stages: Grasses $\rightarrow$ Shrubs $\rightarrow$ Shade-intolerant trees (Pines).
- Climax Community: Shade-tolerant trees (Oaks, Maples). A stable community that undergoes little change until the next disturbance.
Anthropogenic Threats to Biodiversity (HIPPCO)
While natural disruptions occur, humans accelerate loss. Remember the acronym HIPPCO:
- Habitat Destruction (The #1 threat; e.g., deforestation).
- Invasive Species (No natural predators; e.g., Kudzu, Zebra Mussel).
- Population Growth (Human overpopulation increasing resource demand).
- Pollution (Chemicals, plastics, oil spills).
- Climate Change (altering temperature/precipitation tolerance ranges).
- Overexploitation (Overfishing, poaching).
Common Mistakes & Pitfalls
- Survival/Evolution Misconception:
- Wrong: "The animals needed to reach high leaves, so they grew longer necks."
- Right: Individuals cannot evolve. Populations evolve over generations via Natural Selection. Animals with random mutations for longer necks survived better.
- Primary vs. Secondary Succession:
- Wrong: Thinking a forest fire leads to primary succession.
- Right: Fire leaves the soil intact. That is Secondary succession. Primary is strictly starting from bare rock/no soil.
- Species Richness vs. Evenness:
- Wrong: Using the terms interchangeably.
- Right: Richness is the count of types. Evenness is how balanced the numbers are.
- Regulating vs. Supporting Services:
- Wrong: Categorizing "bees pollination" as a supporting service.
- Right: Pollination is a Regulating service (regulates crops/plants). Soil formation is Supporting (happens over long geologic time).
- Generalist vs. Invasive:
- Wrong: Assuming all generalists are invasive.
- Right: While many invasive species are generalists (rat, cockroach), being a generalist is just a niche type. A raccoon is a generalist native to North America; it is not invasive there.