Comprehensive Guide to Human Population Change
Unit 3: Human Population Dynamics
This guide covers the essential mechanisms driving human population systems, drawing from the AP Environmental Science curriculum (Unit 3). It focuses on how populations grow, how they are measured, and the socioeconomic models used to predict future trends.
Human Population Dynamics & Growth Factors
Human populations follow the same fundamental biological laws as other species, but our ability to alter our environment gives us a unique relationship with Carrying Capacity ($K$).
Malthusian Theory vs. Innovation
There are two competing views on human growth limits:
- Malthusian Theory: Proposed by Thomas Malthus (1798). He argued that while food perception grows linearly (arithmetically), human population grows exponentially (geometrically). Eventually, the population exceeds the food supply, leading to a "Malthusian Catastrophe" (famine, disease, war).
- Technological Optimism (Boserup Hypothesis): Humans can alter Earth's carrying capacity through innovation (e.g., the Green Revolution, fertilizers, vertical farming), delaying or preventing the check on population.
Factors Affecting Growth
Population change is driven by four variables: Births, Deaths, Immigration (in), and Emigration (out).
- Density-Independent Factors: Factors that strike regardless of population density (e.g., storms, heatwaves, forest fires).
- Density-Dependent Factors: Factors that become more severe as population limits are approached (e.g., disease transmission, access to clean water, food availability).
Calculating Population Change
To calculate the Global Population Growth Rate (excluding migration, as people don't migrate off Earth yet):
To calculate the National Population Growth Rate (including migration):
Variables Key:
- $r$: Growth rate (as a percentage, \%)
- CBR: Crude Birth Rate (births per 1,000 individuals)
- CDR: Crude Death Rate (deaths per 1,000 individuals)
- $I$: Immigration Rate (per 1,000)
- $E$: Emigration Rate (per 1,000)
Note: Because CBR and CDR are per 1,000, we divide by 10 to convert the result into a percentage (per 100).
The Rule of 70
A critical shortcut for APES math to calculate Doubling Time.
- $DT$: Doubling Time (in years)
- $r$: Growth rate percentage (enter as a whole number, e.g., for 2\%, use 2, NOT 0.02)
Example Problem:
A country has a growth rate of 1.4\%. How long will it take for its population to double?
- Solution: $DT = 70 / 1.4 = 50$ years.
Total Fertility Rate (TFR)
Total Fertility Rate (TFR) is defined as the average number of children a woman will bear throughout her childbearing years (typically ages 15–49).
Replacement Level Fertility
This is the TFR required to offset the average number of deaths in a population so that the current population size remains stable.
- Developed Countries: The replacement level is approximately 2.1.
- Developing Countries: The rate is higher (often >2.5) due to higher infant and child mortality rates.
- Why the 0.1? It accounts for children who die before reaching reproductive age.
Factors Affecting TFR
TFR is the primary determinant of population growth. Several sociopolitical factors influence it:
- Education of Women: This is the #1 predictor of TFR. As female literacy and education rates rise, TFR falls (delayed marriage, career focus).
- Access to Family Planning: Availability of contraceptives and reproductive health education.
- Age of First Pregnancy: The later a woman has her first child, the fewer children she is statistically likely to have.
- Government Policies: Pro-natalist (tax credits for babies) vs. Anti-natalist (One Child Policy) programs.
- Need for Labor: In agrarian societies, children are economic assets (farm labor), leading to higher TFR.
Age Structure Diagrams (Population Pyramids)
Age structure diagrams visualize the distribution of ages and sexes within a population. These graphs are powerful tools for predicting future population momentum.
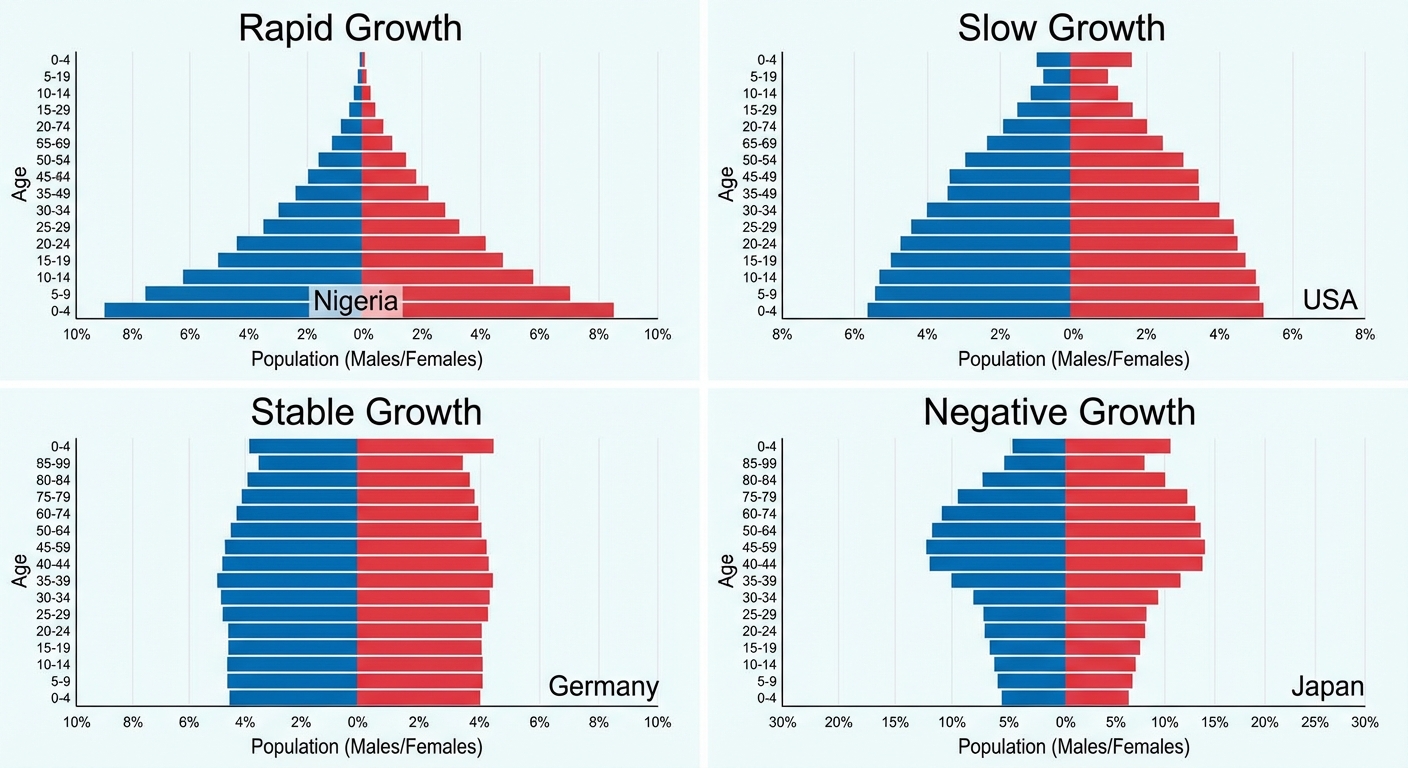
Interpreting the Shapes
| Shape Description | Growth Rate | Common Examples | Explanation |
|---|---|---|---|
| Wide Base / Pyramid | Rapid Growth | Nigeria, Guatemala | High percentage of young people (0-14). Even if TFR drops, population momentum ensures growth as these youth enter reproductive age. |
| Slightly Wide Base | Slow Growth | USA, Australia | The base is slightly wider than the middle. Growth is occurring but stabilizing. |
| Vertical / Column | Zero Growth (Stable) | Germany (current), Japan (previous) | The base is similar in width to the reproductive cohorts. Replacement level TFR is roughly met. |
| Inverted Pyramid | Negative Growth (Declining) | Italy, Russia | The base is narrower than the top. Fewer children are being born than people are aging out, leading to demographic fatigue. |
Prereproductive vs. Reproductive
- 0-14 Years (Prereproductive): The most critical indicator of future growth.
- 15-44 Years (Reproductive): The current working and birthing demographic.
- 45+ Years (Postreproductive): Indicates an aging population; high proportion here suggests high healthcare and pension costs.
The Demographic Transition Model (DTM)
The DTM is a theoretical model of economic and cultural change. It explains how industrialization leads to predictable shifts in birth and death rates.
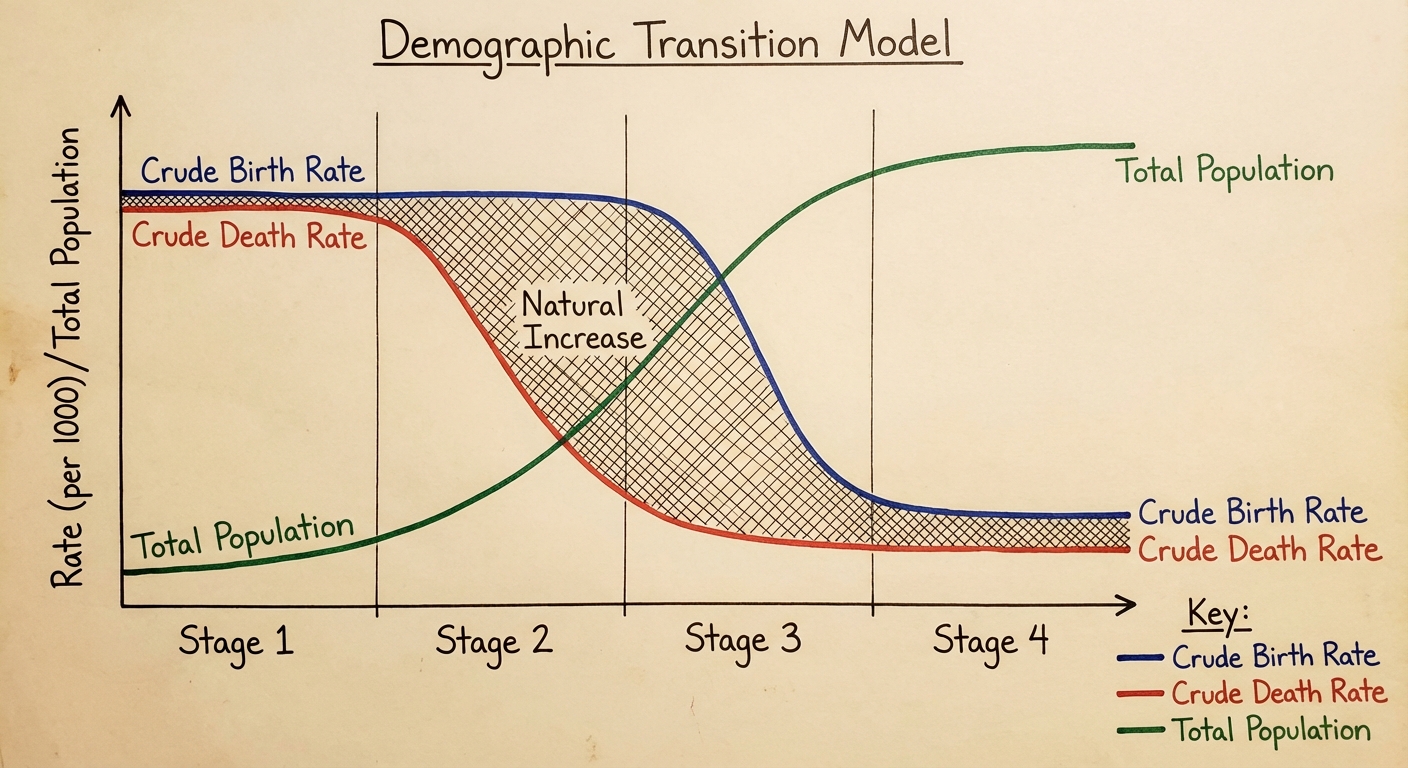
Stage 1: Pre-Industrial
- Status: No countries remain here (only isolated indigenous tribes).
- CBR: High (Need farm labor, high infant mortality compensation).
- CDR: High (Disease, famine, poor sanitation).
- Population Growth: Low/Zero (High - High = 0).
Stage 2: Transitional (Early Industrial)
- Status: Sub-Saharan Africa, parts of South Asia.
- CBR: Remains High (Cultural lag—people haven't realized children act as liabilities yet; lack of education/rights for women).
- CDR: Drops Rapidly (Introduction of modern medicine, sanitation, clean water).
- Population Growth: Explosive (Large gap between high CBR and dropping CDR).
Stage 3: Industrial
- Status: Mexico, India, Columbia (Emerging economies).
- CBR: Starts to Drop (Urbanization makes children expensive; improved female education/employment).
- CDR: Risks stabilizing at a low level.
- Population Growth: Slowing down, but population is still growing.
Stage 4: Post-Industrial
- Status: UK, Japan, Germany.
- CBR: Low (Career focus, family planning, high cost of living).
- CDR: Low.
- Population Growth: Zero or Negative (if CBR drops below CDR).
Memory Aid: Remember the cause of the shift. Stage 2 is caused by Sanitation/Medicine (Death rates drop). Stage 3 is caused by Economics/Education (Birth rates drop).
Common Mistakes & Pitfalls
Confusing "Slowing Growth" with "Decreasing Population"
- Correction: If a growth rate drops from 2.0\% to 1.0\%, the population is still growing, just slower. The population only decreases when the growth rate is negative.
Misinterpreting Stage 2 of DTM
- Correction: Students often think the population boom in Stage 2 is because birth rates go up. This is wrong. Birth rates stay high/flat; the boom is strictly because death rates crash and birth rates haven't caught up yet.
Decimal Points in Rule of 70
- Correction: If $r = 5\%$, calculate $70/5$. Do not calculate $70/0.05$. The formula is derived to use the whole number percentage.
Forgetting Units
- Correction: Always check if data is given as "Total Births" or "CBR". CBR is per 1,000. If you subtract CBR - CDR, your answer is per 1,000. You must divide by 10 to get the percentage.
Assuming Density-Dependent means "Humans Only"
- Correction: Density-dependent factors (disease, competition) affect all species. However, human technology (vaccines, agriculture) can temporarily mitigate these factors.