Unit 1: Foundations of Microeconomic Thinking
Scarcity and the Factors of Production
Economics is fundamentally the study of how individuals and societies manage scarcity. Scarcity exists because society has unlimited wants but limited resources. It is the central problem of economics and applies to everyone—individuals, firms, and governments.
The Definition of Economics
Economics is not just about money; it is the social science concerned with the efficient use of scarce resources to achieve the maximum satisfaction of economic wants.
The Four Factors of Production
To produce goods and services, an economy uses resources known as the Factors of Production. You must memorize these four categories:
- Land: All natural resources used in the production process (e.g., water, oil, minerals, arable land, forests).
- Labor: The physical and mental effort contributed by people to the production of goods and services.
- Capital: This is often confused by students. In economics, this refers to Physical Capital—human-made resources used to produce other goods (e.g., factories, tractors, hammers, computers).
- Note: Money is NOT capital in this context; money is a medium of exchange, not a productive resource.
- Human Capital: The skills, knowledge, and experience possessed by the labor force.
- Entrepreneurship: The unique ability to combine the other three factors to create a product or service. Entrepreneurs take risks to earn profits.
Opportunity Cost and Decision Making
Because resources are scarce, every choice involves a trade-off. However, the Opportunity Cost is specific: it is the value of the single next-best alternative foregone when a decision is made.
Calculating Opportunity Cost
It is not the sum of all alternatives, but the value of the best one given up.
Example: If you spend an hour studying Economics, you give up the opportunity to watch TV, sleep, or work at a job. If working would have earned you $15 and that was your best alternative, your opportunity cost is $15 (plus the utility of the leisure you missed).
Marginal Analysis
Rational economic decisions are made at the margin. This involves comparing the Marginal Benefit (MB) of doing one more unit of an activity against the Marginal Cost (MC).
- The Rule: Do the action if .
- Stop doing the action when MC > MB .
The Production Possibilities Curve (PPC)
The Production Possibilities Curve (also called the Production Possibilities Frontier) is a graphical model that illustrates the concepts of scarcity, trade-offs, and efficiency.

Interpreting the Graph
Following the diagram above:
- Points on the curve (A, B, C): Represent Productive Efficiency. The economy is using all resources to their maximum potential.
- Points inside the curve (D): Represent Inefficiency or unemployment. Resources are underutilized.
- Points outside the curve (E): Currently Impossible (unattainable) with current resources and technology.
Shape of the PPC: Constant vs. Increasing Opportunity Cost
The shape of the curve tells a story about the resources being used.
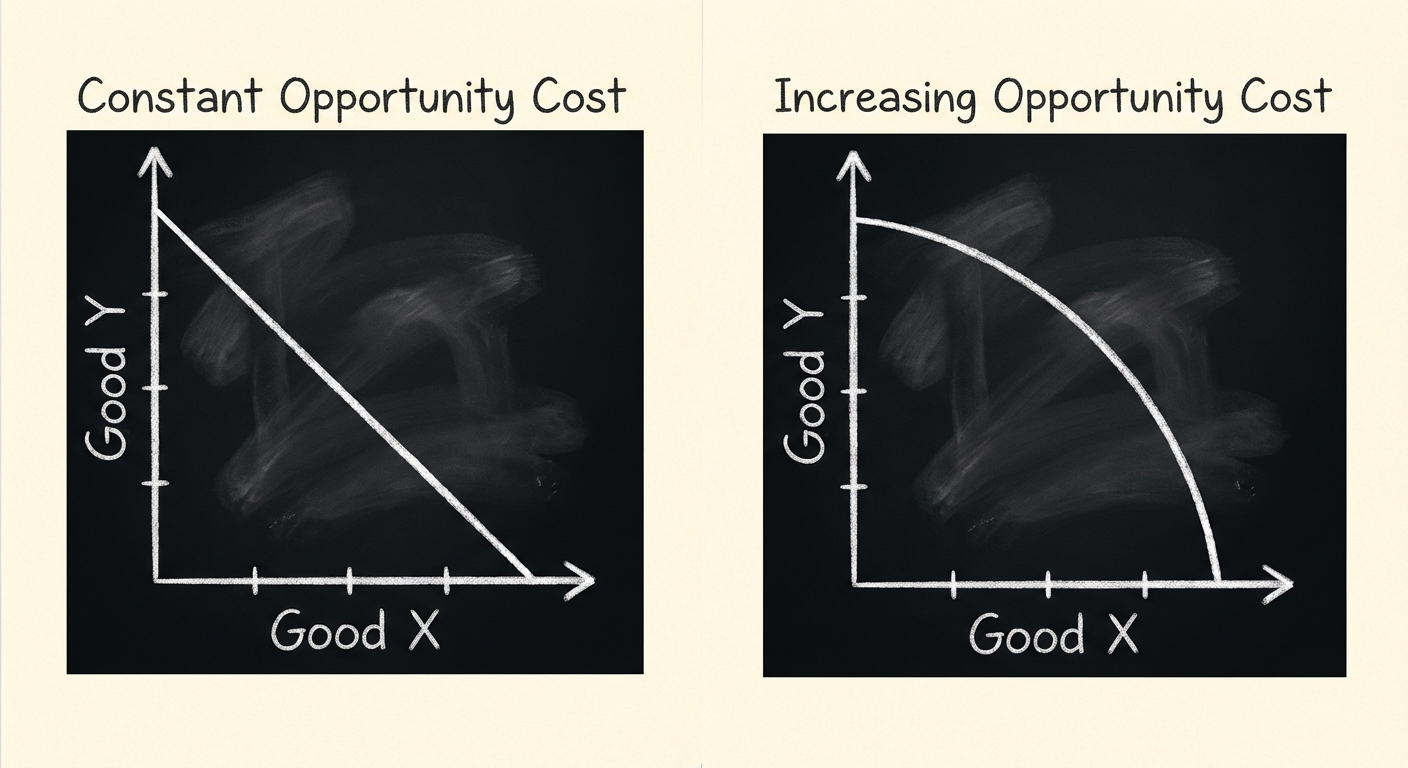
- Concave (Bowed Out) PPC: Represents the Law of Increasing Opportunity Costs.
- Reasoning: Resources are not perfectly adaptable. As you produce more of Good X (e.g., Pizza), you must shift resources (like industrial ovens) from Good Y (e.g., Robots) that are not well-suited for making pizza. You give up increasingly more Robots to get the same amount of extra Pizza.
- Linear (Straight Line) PPC: Represents Constant Opportunity Cost.
- Reasoning: Resources are perfectly adaptable between the two goods (e.g., Calzones vs. Pizza).
Shifting the PPC
The PPC shifts outward (economic growth) only if:
- There is an increase in the Quantity or Quality of resources (Factors of Production).
- There is an improvement in Technology.
- Shift vs. Movement: Moving from a point inside the curve to the curve is recovering from inefficiency. Moving the entire curve outward is economic growth.
Comparative Advantage and Trade
Trade allows diverse economies to consume more than they could produce alone. This relies on the distinction between Absolute and Comparative Advantage.
Key Definitions
- Absolute Advantage: Who can produce more of a good with the same resources, OR who can produce one unit using fewer resources.
- Comparative Advantage: Who can produce a good at a lower opportunity cost.
The Calculation Rules (Mnemonics)
To solve these problems, look at whether the data represents Output (how much is made) or Input (how much time/resources required).
1. Output Method (Other Goes Over)
Data shows the number of goods produced (e.g., Cars vs. Computers created in a day).
2. Input Method (Other Goes Under)
Data shows resources required to make one unit (e.g., Hours to bake a cake).
Worked Example: Output Problem
Consider the daily production of two countries:
| Country | Radios | TV Sets |
|---|---|---|
| Japan | 10 | 5 |
| USA | 8 | 2 |
- Absolute Advantage: Japan has an absolute advantage in both (10 > 8 and 5 > 2).
- Comparative Advantage: Calculate Opportunity Costs.
- Japan (Radios): TV sets.
- USA (Radios): TV sets.
- Conclusion: USA has the lower opportunity cost (0.25 < 0.5) for Radios. USA should specialize in Radios. Japan should specialize in TVs.
Terms of Trade
For trade to be mutually beneficial, the trading price must fall between the opportunity costs of the two countries.
- In the example above, 1 Radio trades for between 0.25 TVs and 0.5 TVs.
Common Mistakes & Pitfalls
- Money is Capital: This is the most frequent error. In AP Econ, Capital always refers to tools, machinery, and factories (physical capital) or skills (human capital), never cash.
- Confusing Efficiency with Equity: A point on the PPC is allocatively efficient if it represents the mix of goods society wants, and productively efficient if it is on the line. The PPC tells us nothing about whether the distribution of goods is "fair" (equity).
- Shifting the PPC for Unemployment: Unemployment is represented by a point inside the curve. It does NOT shift the curve inward. The curve represents possibilities (capacity), not current utility.
- Mixing up Input/Output Methods: Always check the table header. If the numbers represent "Hours to produce 1 unit," use IOU (Input Other Under). If the numbers represent "Total units produced," use OOO (Output Other Over).