Mastering ACT Science: reasoning, Data Analysis, and Experimental Design
Understanding the ACT Science Section Structure
The ACT Science section is widely misunderstood. Despite its name, it acts more like a reading comprehension test for scientific text and data than a test of raw scientific knowledge. You do not need to memorize the Periodic Table or complex physics formulas. Instead, you are tested on your ability to read graphs, interpret experimental setups, and analyze conflicting scientific arguments.
The Three Passage Formats
To score well, you must recognize the three distinct passage types, as each requires a different strategic approach:
- Data Representation (30–40%): These passages focus heavily on graphs, charts, tables, and diagrams. The text is minimal. Your goal is to extract specific data points and identify trends.
- Research Summaries (45–55%): These describe specific experiments (e.g., Experiment 1, Experiment 2). You must understand the scientific method, identify variables, and compare results across different experimental conditions.
- Conflicting Viewpoints (15–20%): Often called the "Fighting Scientists" passage. You will read two or three differing hypotheses or theories about a phenomenon (e.g., why dinosaurs went extinct). You must analyze logic, find similarities/differences, and evaluate evidence.
Data Representation: Mastering Graphs and Tables
The most fundamental skill in ACT Science is visual literacy. You must be able to translate visual data into specific answers rapidly.
Anatomy of a Graph
Before looking at the question, spend 15–20 seconds orienting yourself with the data.
- Axes: What is plotted on the x-axis (independent variable) and the y-axis (dependent variable)? Check the units (e.g., seconds, m/s, °C).
- Scales: Do the numbers increase linearly (10, 20, 30) or exponentially (10, 100, 1000)?
- Keys/Legends: In complex graphs, solid lines might represent one substance while dashed lines represent another.

Trends and Relationships
Questions often ask you to describe the relationship between variables. Use the following terminology:
- Direct Relationship (Positive Correlation): As $x$ increases, $y$ increases. (The line goes up).
- Inverse Relationship (Negative Correlation): As $x$ increases, $y$ decreases. (The line goes down).
- Flat/No Relationship: As $x$ changes, $y$ stays the rest same.
- Curvilinear/Exponential: The rate of change speeds up or slows down.
Interpolation vs. Extrapolation
Since you cannot use a calculator, you must be comfortable estimating.
- Interpolation: Finding a value inside the range of known data points.
- Example: If you have data for 10 min and 20 min, finding the value for 15 min.
- Extrapolation: Predicting a value outside the known range by extending the trend line.
- Example: If data stops at 50°C, predicting what happens at 80°C.
Common Mistakes: Data Representation
- The Unit Trap: Confusing meters with centimeters or milliseconds with seconds. Always check if the question allows you to use the raw number or requires a conversion (which is usually simple, like $\times 1000$).
- Wrong Axis: On double y-axis graphs (see Image 0), students frequently read the solid line's value using the dotted line's axis. Always trace the line back to its specific axis label.
Research Summaries: The Scientific Method
These passages simulate a lab report. Success here depends on identifying the components of the experiment.
Key Variables (DRY MIX)
A crucial mnemonic for ACT Science is DRY MIX.
| Acronym Part | Meaning | Description |
|---|---|---|
| D-R-Y | Dependent Responding Y-axis | The variable being measured/observed. It "responds" to changes. |
| M-I-X | Manipulated Independent X-axis | The variable the scientist changes intentionally to see what happens. |
The Control Group
A Control Group is a sample that receives no experimental treatment or standard treatment. It serves as a baseline for comparison.
- Example: If testing a new fertilizer on plant growth, the control group is the plant getting only water. If the control plant dies, the experiment is invalid.
Experimental Design and Logic
Questions will often ask: "Why did the scientist add Step 4?" or "Suppose a new trial was done with X condition…"
- Constants: Conditions kept exactly the same across all trials (e.g., temperature, amount of water) to ensure that only the Independent Variable affects the result.
- Logic: If Trial 1 has result $A$, and Trial 2 (with more heat) has result $B$, you can determine the effect of heat specific to that context.

Common Mistakes: Research Summaries
- Conflating Experiments: Be careful not to use data from Experiment 1 to answer a question specifically about Experiment 2, unless the question explicitly asks you to compare them.
- Ignoring the Methods Section: Skimming the introductory text is usually fine, but if a question asks how something was measured, you must go back and read the "text" part of the experiment description.
Conflicting Viewpoints: Scientific Debate
This is the only section where you are reading closer to a humanities style. You have 2–4 scientists/students giving different reasons for an observation.
Strategy: The "Anchor" Method
Do not try to determine who is "right" (sometimes all are wrong). Instead, create a mental or physical table:
- Identify the Core Question: What are they arguing about? (e.g., Is the object a comet or an asteroid?)
- Scientist A's Stance:
- Thesis: It is a comet.
- Evidence: It has an ice tail.
- Scientist B's Stance:
- Thesis: It is an asteroid.
- Evidence: Its density is too high for ice.
Assessing Agreement and Disagreement
ACT questions will ask: "On which point would Scientist A and Scientist B agree?"
- Look for shared data. Even if they disagree on the conclusion, they often agree on the observation (e.g., they agree the object is traveling fast, but disagree on why).
Common Mistakes: Conflicting Viewpoints
- Using Outside Knowledge: If you know for a fact that Scientist A is wrong based on your biology class, ignore that. You must answer based only on the text provided.
- Switching Perspectives: Ensure you are looking at the correct paragraph. It is easy to accidentally read Scientist 2's opinion when the question asks about Scientist 1.
Essential Background Knowledge
While the ACT is 95% reading/reasoning, the remaining 5% requires "common knowledge" science facts. You will not find the definitions for these in the passages.
Biology Basics
- Photosynthesis: Plants use sunlight + $\text{CO}2$ + $\text{H}2\text{O}$ to make Glucose (sugar) + $\text{O}_2$.
- Respiration: The reverse of photosynthesis. Cells use Glucose to create energy (ATP).
- Genetics:
- DNA: Genetic blueprint.
- Alleles: Different forms of a gene (Dominant vs. Recessive).
- Genotype vs. Phenotype: Genes vs. physical traits.
Chemistry Basics
- pH Scale:
- $pH < 7$: Acidic (lots of $\text{H}^+$ ions).
- $pH = 7$: Neutral (pure water).
- $pH > 7$: Basic/Alkaline (lots of $\text{OH}^-$ ions).
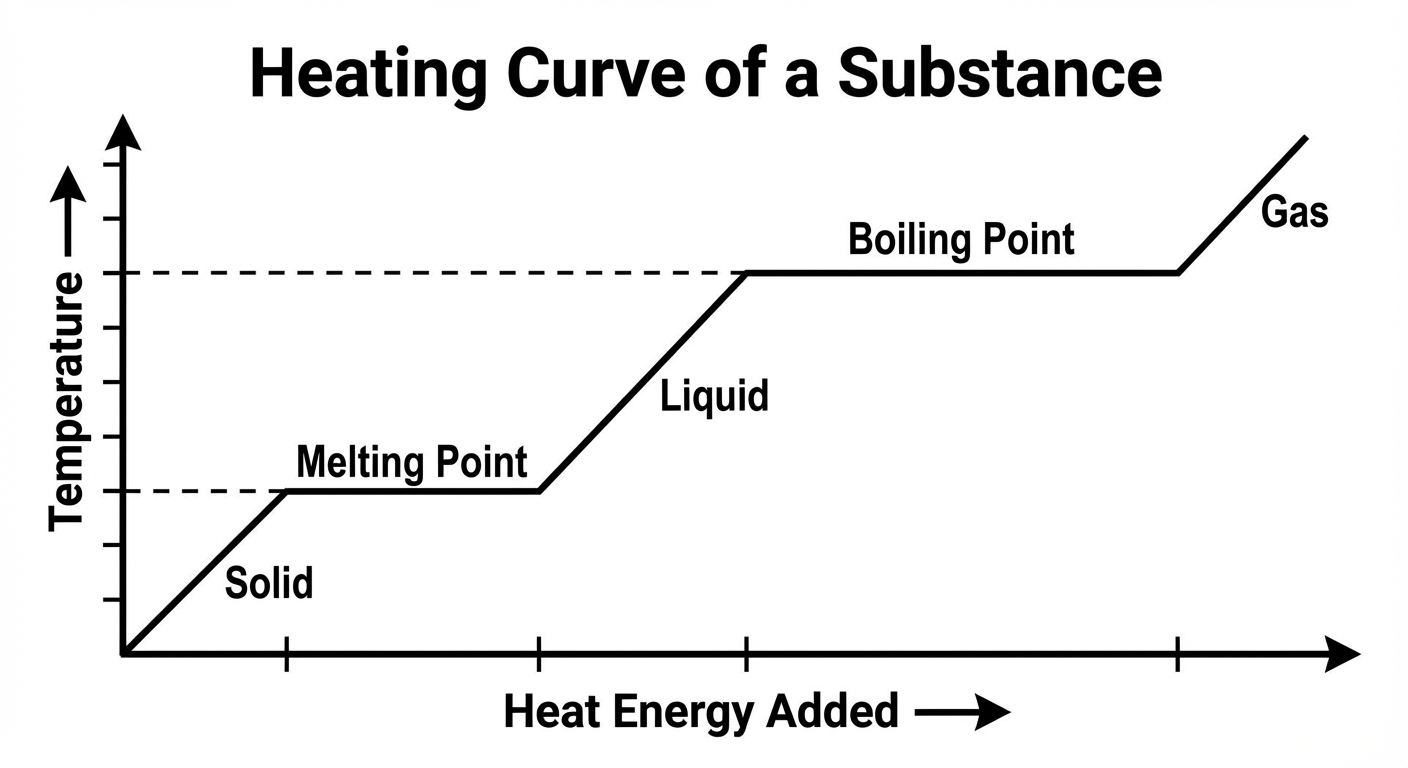
- Phase Changes:
- Melting (Solid to Liquid) / Freezing (Liquid to Solid).
- Boiling (Liquid to Gas) / Condensation (Gas to Liquid).
- Freezing Point: The temperature where liquid turns solid.
- Boiling Point: The temperature where liquid turns gas (usually dependent on pressure).
Physics Basics
- Density Formula: \rho = \frac{m}{V}
- Rule: Less dense objects float on more dense fluids.
- Kinetic vs. Potential Energy:
- Kinetic (KE): Energy of motion. Increases with speed.
- Potential (PE): Stored energy. Gravitational PE increases with height.
- Charges: Like charges repel ($+/+$), opposite charges attract ($+/-$).
Math Strategies for Science
Calculators are not allowed on the Science section. You must use estimation and basic arithmetic.
Scientific Notation
You must be comfortable reading large and small numbers.
- $3.5 \times 10^3 = 3,500$
- $2.1 \times 10^{-2} = 0.021$
Percentage estimation
Questions may ask if a value increased by more or less than 50%.
- $\text{Percent Change} = \frac{\text{New} - \text{Old}}{\text{Old}} \times 100$
- Tip: Establish benchmarks. If you start with 50 and end with 75, that is exactly 50% (half of 50 is 25; $50+25=75$).
Final Summary: The "Locators" Rule
To maximize efficiency, treat every question like a treasure hunt. Use Locators:
- Identify the location: Does the question say "In Figure 1…" or "Based on Experiment 2…"? Go there immediately.
- Identify the variable: Does the question ask about "Viscosity"? Find the word "Viscosity" on the axis or in the table.
- Trace the value: Follow the line or column to the answer.
Common Pitfall: Thinking too hard. The answer is almost always physically printed on the page. If you are doing complex mental gymnastics, you likely missed a simple data point in the graph.