AP Environmental Science: Unit 1 Energy Dynamics
Unit 1: Energy Flow in Ecosystems
Starting your journey into AP Environmental Science (APES), understanding how energy moves through the living world is fundamental. This section covers the physics of life—specifically, how solar energy is converted into chemical energy and distributed through ecosystems. This forms the basis for Topics 1.8 through 1.11 in the College Board curriculum.
1. Primary Productivity
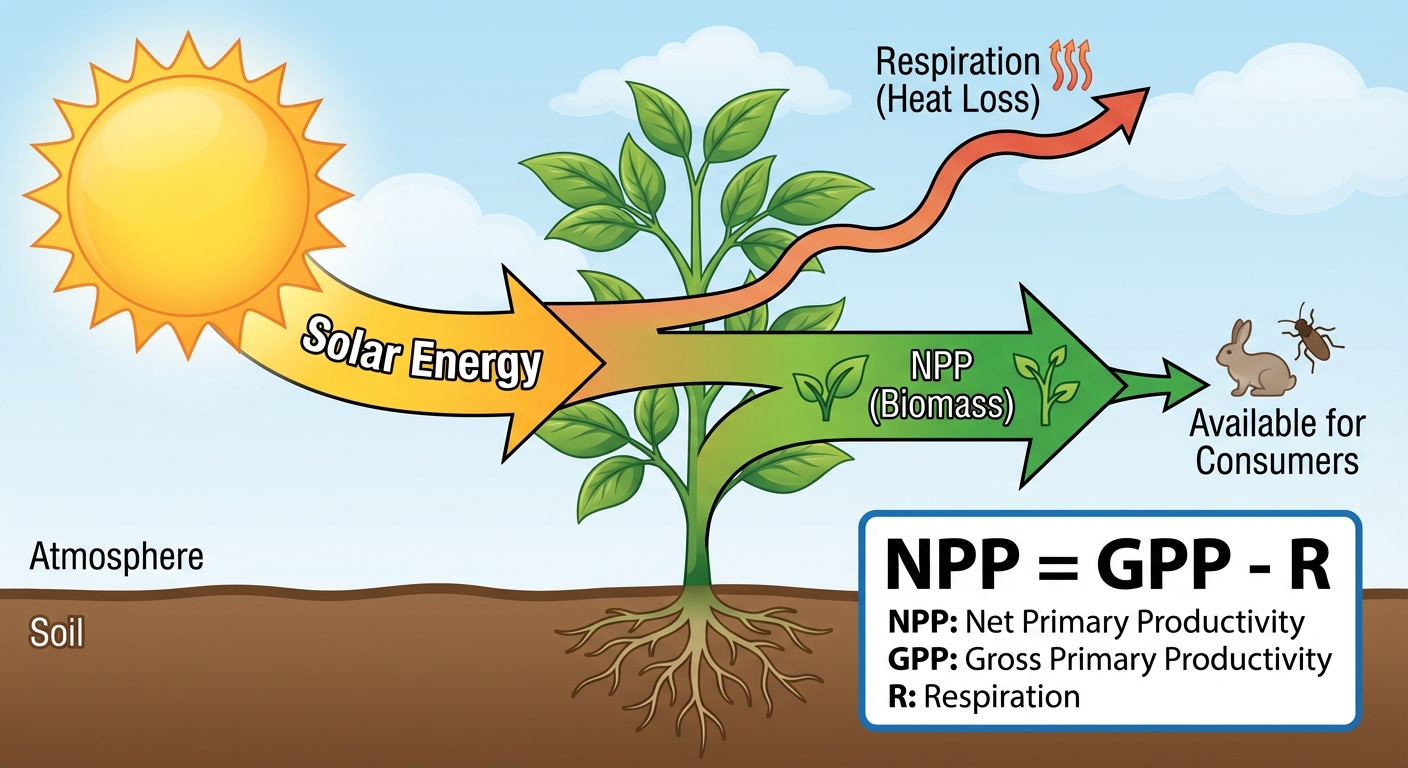
The engine of any ecosystem is sunlight. Primary Productivity is the rate at which solar energy (sunlight) is converted into organic compounds (sugars) via photosynthesis over a unit of time.
Gross Primary Productivity (GPP)
Think of GPP as the "total paycheck" an ecosystem earns.
- Definition: The total rate of photosynthesis in a given area.
- Concept: It is the total amount of sun energy that plants capture and convert to energy (glucose).
- Limitations: Plants don't get to keep all of this energy; they must spend some to survive.
Net Primary Productivity (NPP)
Think of NPP as the "take-home pay" after taxes are deducted.
- Definition: The rate of energy storage by photosynthesizers in a given area, after subtracting the energy lost to respiration.
- Respiration ($R$): The energy plants use for their own cellular maintenance, growth, and reproduction (released as heat).
- Importance: NPP is the actual amount of biomass available to be eaten by consumers (herbivores).
The Golden Formula
You must memorize and be able to manipulate this formula for the AP exam:
Where:
- $NPP$ = Net Primary Productivity
- $GPP$ = Gross Primary Productivity
- $R$ = Respiration
Factors Affecting Productivity
Ecosystems vary wildly in how productive they are based on:
- Temperature: Warmer is generally better (kinetics).
- Water availability: Essential for photosynthesis.
- Nutrient availability: Nitrogen and Phosphorus are often limiting factors.
Productivity Ranking Table
| Efficiency Level | Ecosystem Examples | Why? |
|---|---|---|
| High | Swamps, Marshes, Tropical Rainforests, Coral Reefs | High temps, high water, consistent sunlight. |
| Medium | Temperate Forests, Grasslands | Seasonal limitations (winter/drought). |
| Low | Deserts, Open Ocean, Tundra | Lack of water (desert) or nutrients (open ocean). |
Note: While the open ocean has very low productivity per square meter, it contributes a massive amount to global NPP simply because it covers ~70% of Earth.
2. Trophic Levels
Organisms are categorized by how they acquire energy. These categories are called trophic levels (feeding levels).
The Hierarchy
- Producers (Autotrophs): Organisms that conduct photosynthesis (plants, algae, phytoplankton) or chemosynthesis (deep-sea bacteria). They form the base of the food chain.
- Primary Consumers: Herbivores that eat producers (e.g., crickets, zooplankton, cows).
- Secondary Consumers: Carnivores or omnivores that eat primary consumers (e.g., birds, frogs, small fish).
- Tertiary Consumers: Apex predators at the top of the chain (e.g., eagles, sharks, orcas).
Decomposers and Detritivores
These organisms exist outside the partial linear hierarchy but are essential.
- Detritivores (e.g., earthworms, vultures): Physically break down dead tissues and waste products.
- Decomposers (e.g., fungi, bacteria): Chemically break down organic matter into simpler nutrients to be recycled back into the soil.
3. Energy Flow and the 10% Rule
Unlike matter (Carbon, Nitrogen), which cycles, energy flows linearly. It enters as sunlight and exits as heat. It basically obeys the Laws of Thermodynamics.
The Laws of Thermodynamics in Ecology
- First Law (Conservation of Energy): Energy cannot be created or destroyed, only transformed. Solar energy $\rightarrow$ Chemical energy.
- Second Law (Entropy): As energy is transferred, some is lost as heat; the quality of energy decreases. This explains why food chains are short.
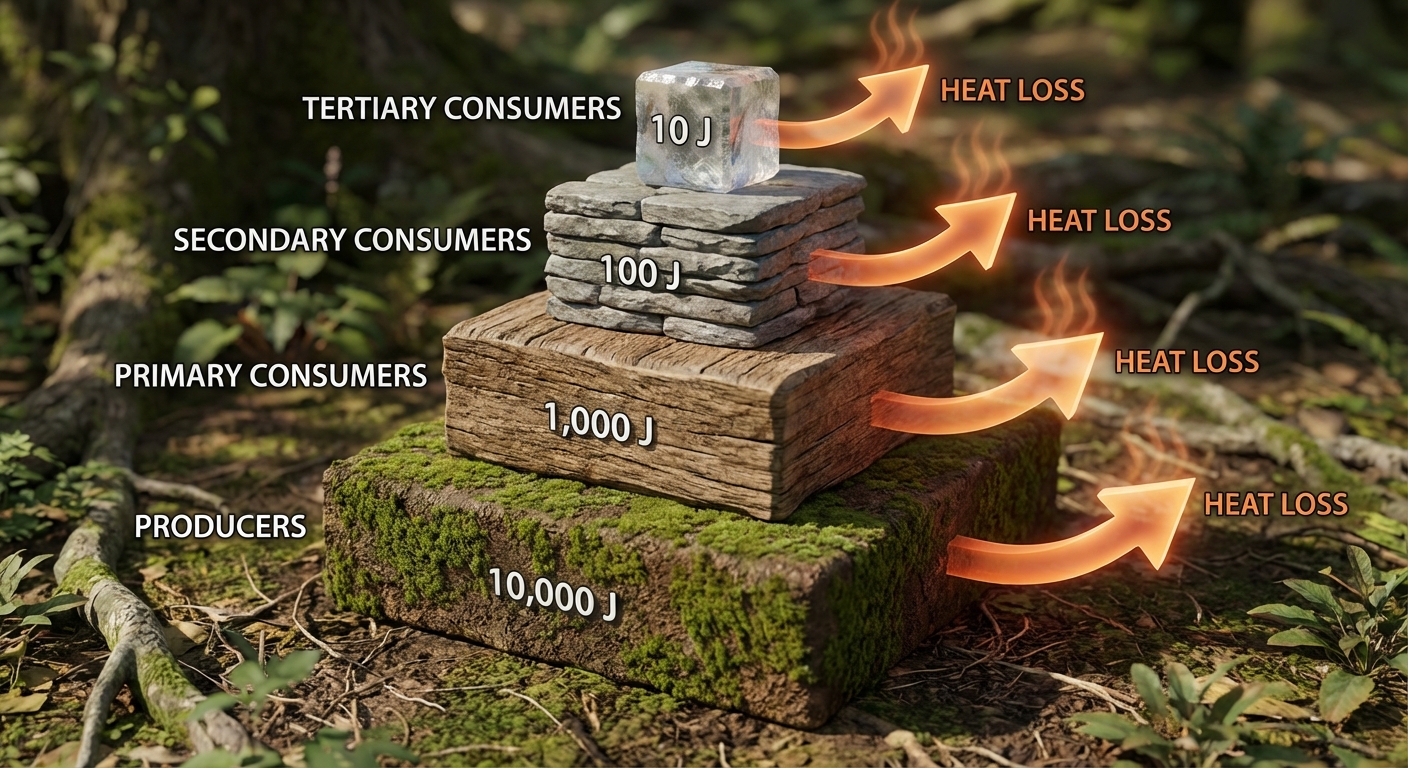
The 10% Rule (Ecological Efficiency)
In general, only about 10% of the energy from one trophic level is transferred to the next level. The remaining 90% is lost as:
- Heat (via movement and metabolism)
- Waste (feces/urine)
- Indigestible material (bones/fur)
Math Application: Calculating Energy Transfer
Prepare for simple math problems involving this rule.
Example Problem:
If a field of grass contains 50,000 J (Joules) of energy, how much energy is available to the secondary consumer (a hawk eating a mouse)?
Solution:
- Step 1: Producers (Grass) = $50,000 \text{ J}$
- Step 2: Primary Consumers (Mouse) = $50,000 \times 0.10 = 5,000 \text{ J}$
- Step 3: Secondary Consumers (Hawk) = $5,000 \times 0.10 = 500 \text{ J}$
Result: The hawk only gains 500 J.
4. Food Chains vs. Food Webs
Food Chains
A linear sequence of organisms where nutrients and energy are transferred from one organism to another.
- Example: Grass $\rightarrow$ Zebra $\rightarrow$ Lion.
- Reality: Rare in nature; too unstable.
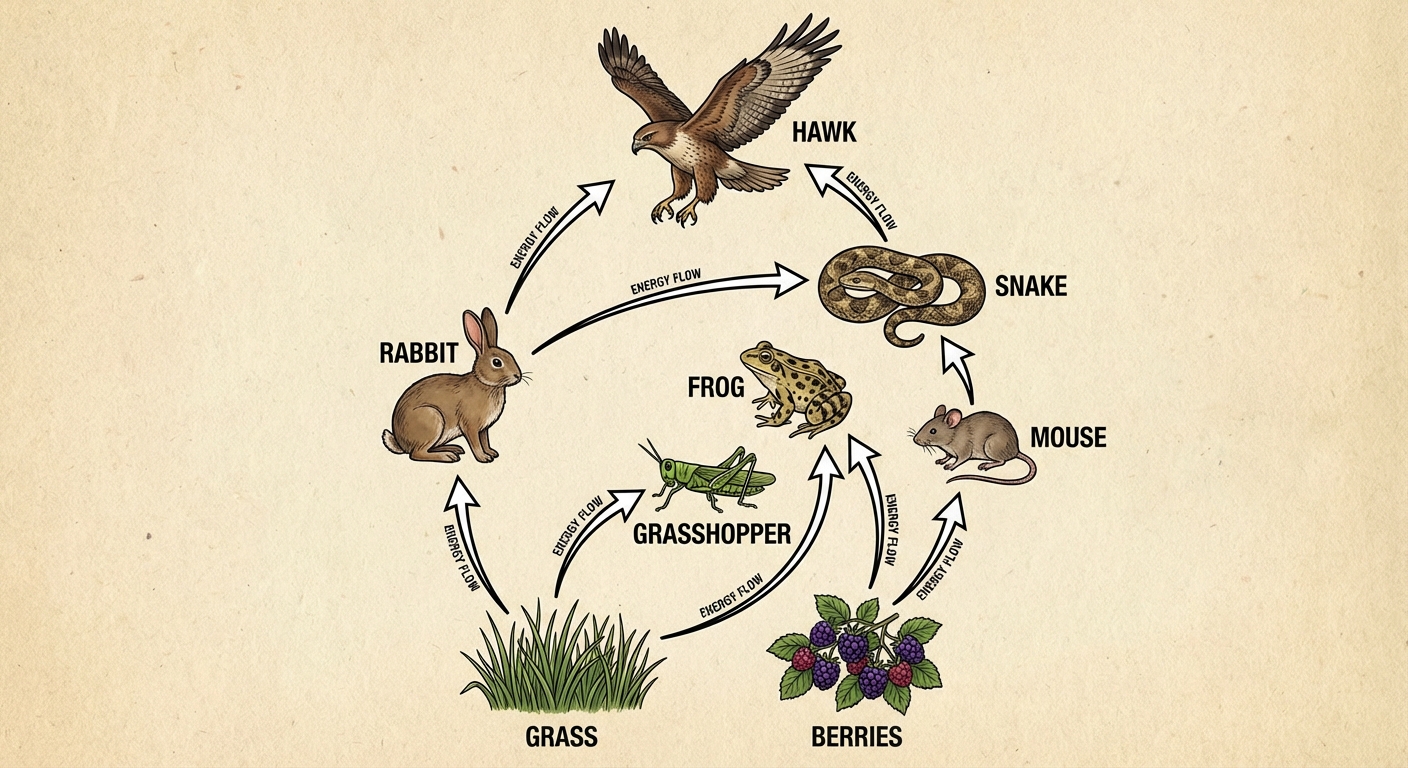
Food Webs
A complex network of interconnected food chains.
- Resilience: Webs are more stable. If one food source is removed, the predator often has alternate options.
- Feedback Loops:
- Positive feedback loop: A change enhances the effect (e.g., less fruit $\rightarrow$ fewer birds $\rightarrow$ less seed dispersal $\rightarrow$ even less fruit).
- Negative feedback loop: A change dampens the effect (e.g., many rabbits $\rightarrow$ more foxes $\rightarrow$ fewer rabbits).
Trophic Cascades
This occurs when a predator at a high trophic level suppresses the abundance of prey, which releases the next lower trophic level from predation. The classic example applies to Keystone Species.
- Example Case: Wolves in Yellowstone.
- Removal of Wolves $\rightarrow$ Deer population exploded $\rightarrow$ Deer overgrazed vegetation $\rightarrow$ Erosion increased/Rivers changed course.
- Reintroduction of Wolves $\rightarrow$ Deer population controlled $\rightarrow$ Vegetation recovered.
Common Mistakes & Pitfalls
The Arrow Direction Mistake:
- Mistake: Drawing arrows pointing to who eats whom (e.g., Mouse $\rightarrow$ Grass).
- Correction: Arrows represent the flow of energy. The arrow always points into the mouth of the consumer (Grass $\rightarrow$ Mouse).
Confusing Biomass with Energy:
- Mistake: Assuming the largest animal has the most energy.
- Correction: The base of the pyramid (Producers) always has the most energy and usually the most biomass. Apex predators have the least available energy.
GPP vs. NPP:
- Mistake: Thinking NPP is just photosynthesis.
- Correction: Remember the analogy: GPP is the gross salary; NPP is the net salary (after the "tax" of respiration). NPP is what is actually available for growth and consumption.
Matter vs. Energy:
- Mistake: Saying energy cycles.
- Correction: Energy flows (Sun $\rightarrow$ Heat). Matter (C, N, P, H2O) cycles.