AP CSP Big Idea 2: Data and Information Basics
Topic 2.1: Binary Numbers and Bits
The Atom of Information: The Bit
At the lowest level of abstraction, all digital data is represented by bits. A bit (binary digit) is the smallest unit of data in a computer, which can hold only one of two values: 0 or 1.
- Abstraction: Bits are grouped together to represent higher-level abstractions like numbers, characters, and colors.
- Byte: A sequence of 8 bits. This is the standard unit for storage size.
Binary (Base 2) vs. Decimal (Base 10)
Computers use binary because hardware relies on easy-to-distinguish electrical states (On/Off, High Voltage/Low Voltage). Humans use decimal because we have ten fingers.
| Feature | Decimal (Base 10) | Binary (Base 2) |
|---|---|---|
| Digits Used | 0, 1, 2, 3, 4, 5, 6, 7, 8, 9 | 0, 1 |
| Place Values | Powers of 10 ($10^0, 10^1, 10^2…$) | Powers of 2 ($2^0, 2^1, 2^2…$) |
| Example | 25 | 11001 |
Converting Binary to Decimal
To convert a binary number to decimal, sum the specific place values where the bit is 1.
The place values determine the value of a bit based on its position, starting from the right (the least significant bit):
Example: Convert binary 1101 to decimal: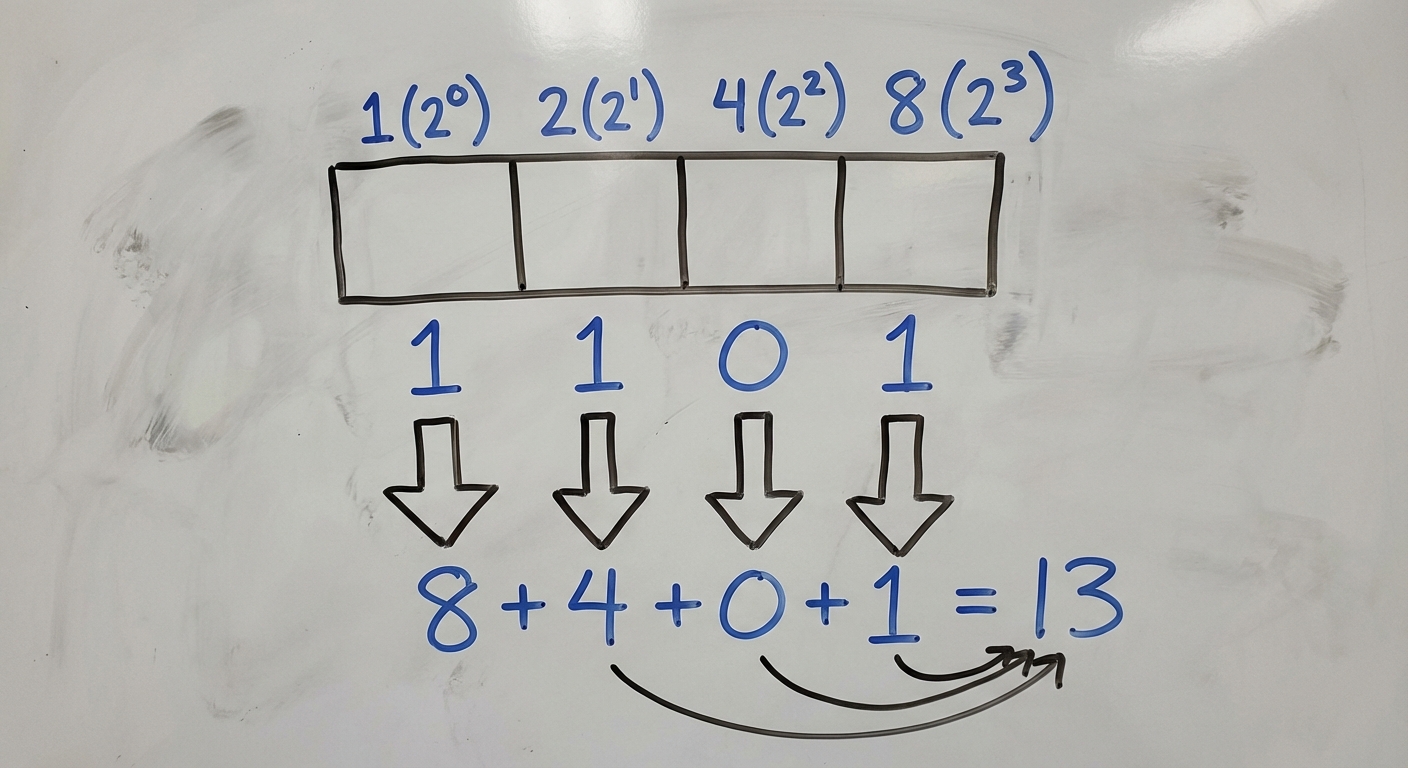
- $1 \times 8 = 8$
- $1 \times 4 = 4$
- $0 \times 2 = 0$
- $1 \times 1 = 1$
- Total: $8 + 4 + 0 + 1 = 13$
Converting Decimal to Binary
To convert a decimal number to binary, find the largest power of 2 that fits into the number, subtract it, and repeat with the remainder until you reach 0.
Example: Convert 20 to binary:
- Largest power of 2 less than 20 is 16 ($2^4$). Put a
1in the 16s place. (Remainder: $20 - 16 = 4$) - Does 8 fit in 4? No. Put a
0. - Does 4 fit in 4? Yes. Put a
1. (Remainder: $4 - 4 = 0$) - Remaining places (2 and 1) are
0. - Result:
10100
Limitations of Storing Numbers
Since computer memory is finite, we cannot represent every number perfectly.
- Overflow Error: Occurs when an integer value is too large to be represented by the fixed number of bits available. It essentially "wraps around" to the minimum value (like a car odometer rolling from 999,999 to 000,000).
- Example: If you have 4 bits, the max value is 15 (
1111). If you try to store 16 (10000), the computer drops the leading 1 (because it only has room for 4 bits) and stores0000(which is 0).
- Example: If you have 4 bits, the max value is 15 (
- Round-off Error: Occurs with floating-point numbers (decimals). Because some fractions (like 1/3 or, in binary, 0.1) have infinite repeating digits, the computer must cut them off. This results in tiny calculation errors (e.g., computers might calculate $0.1 + 0.2$ as $0.30000000000000004$).
Topic 2.2: Encoding Complex Data
Computers use bits to represent non-numerical data through abstraction.
Digital Images
Images are broken down into pixels (picture elements).
- Black & White: 1 bit per pixel ($1=$ black, $0=$ white).
- Color Images (RGB): Each pixel uses 3 channels: Red, Green, and Blue. Common depth is 24 bits (8 bits per channel).
1111 1111(Decimal 255) is the maximum intensity for a color.0000 0000(Decimal 0) is no intensity.- Example: Red mixed with Green = Yellow.

Analog to Digital Conversion
- Analog Data: Continuous, infinite range of values (e.g., sound waves, temperature in the real world, painting on canvas).
- Digital Data: Discrete, finite values (e.g., MP3 files, JPGs).
- Sampling: The process of converting analog to digital by measuring the analog signal at regular intervals.
- Sampling Rate: How often samples are taken. Higher rate = better quality = larger file.
- Bit Depth: How distinguishable the levels are. Higher depth = more precision = larger file.
Topic 2.3: Data Compression
Compression reduces the number of bits needed to transmit or store data. There are two main categories.
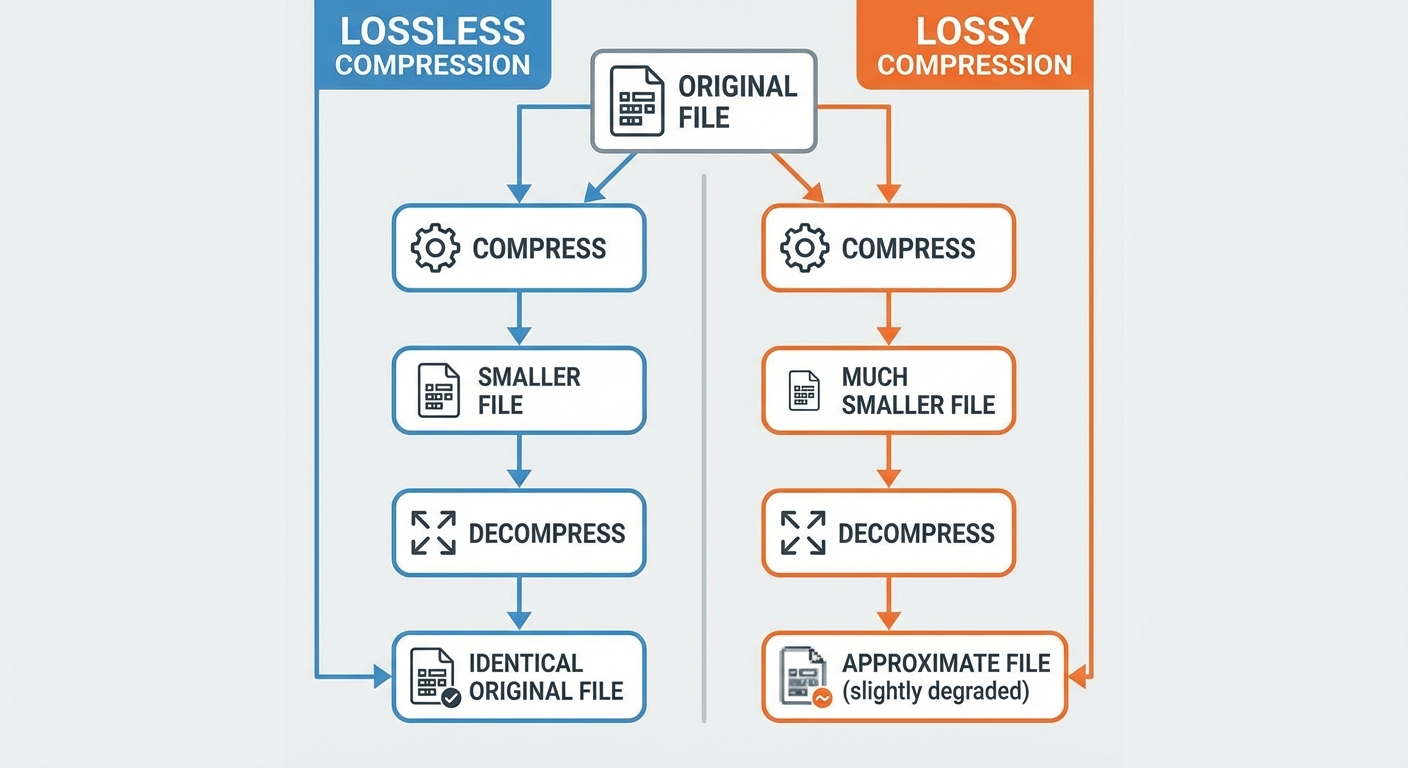
1. Lossless Compression
Reduces the file size without losing any information. The original file can be perfectly reconstructed.
- How it works: Looks for redundancy and patterns.
- Algorithms: Run-Length Encoding (RLE), Huffman Coding.
- Use Cases: Text files, Spreadsheets, code (.zip, .png, .gif).
- Example (RLE):
- Original:
AAAAABBBCCCC(12 characters) - Compressed:
5A3B4C(6 characters)
- Original:
2. Lossy Compression
Significantly reduces file size by throwing away "less important" information. The original file cannot be perfectly restored.
- How it works: Discards data the human eye/ear is unlikely to notice (e.g., removing sounds beyond human hearing range).
- Use Cases: Images, Video, Audio (.jpg, .mp3, .mp4).
- Trade-off: Lossy compression provides much smaller file sizes than lossless, but at the cost of quality.
Common Mistakes: Compression
- Mistake: Thinking you can restore a lossy file to its original quality.
- Correction: Once data is lost via lossy compression, it is gone forever. You cannot convert a low-res pixelated JPEG back into a high-res photo.
- Mistake: Assuming compression always reduces size.
- Correction: If a file has no repeating patterns (essentially random data), lossless compression algorithms usually cannot make it smaller and might even make it slightly larger.
Topic 2.4: Extracting Information from Data
The Data Analysis Process
- Collection: Gathering data from sources (sensors, surveys, transaction logs).
- Cleaning: removing corrupt data, fixing formatting, removing duplicates. Crucial because "Garbage In, Garbage Out."
- Processing/filtering: Sorting or filtering to find subsets of interest (e.g., "Show me only users over age 18").
- Visualization: Creating charts or graphs to identify trends.
Metadata
Metadata is "data about data". It describes the content or context of a file, but not the actual data itself.
- Examples: File size, date created, author name, geolocation (GPS).
- Key Concept: Changing the metadata (e.g., renaming a file) does not change the display data inside the file.
Visualization Tools
Visualizations help humans spot patterns that computers might miss or that are hard to see in raw text tables.
- Bar/Pie Charts: Comparing categories.
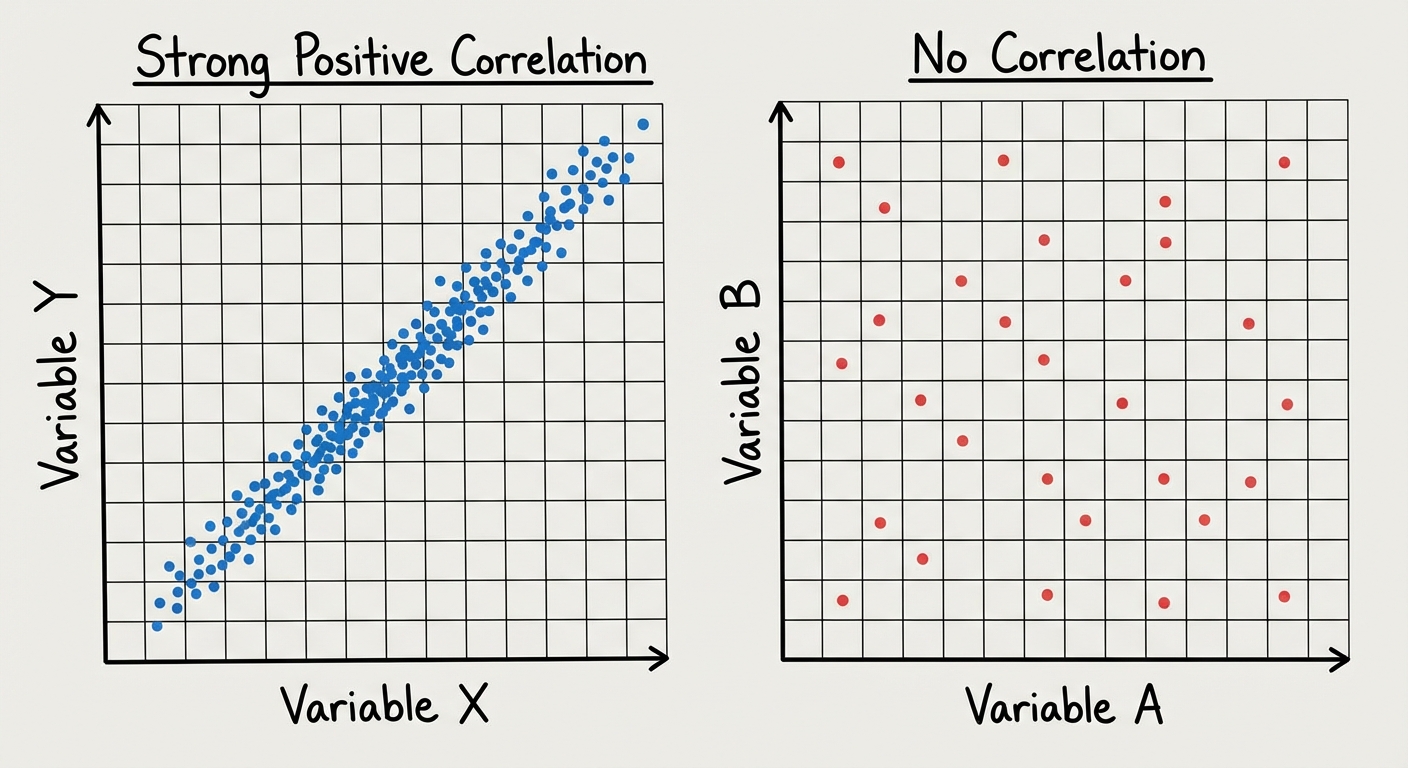
- Scatter Plots: Analyzing relationships between two variables.
- Histograms: Showing the distribution of data ranges.
Bias in Data
Data is not always neutral. Computing innovations can reflect existing human biases.
- Collection Bias: Did you survey only people with landlines? You missed the mobile-only demographic.
- Processing Bias: An algorithm trained on data from one specific group may fail to recognize or accurately predict outcomes for other groups.
Correlation vs. Causation (Crucial AP Concept)
A common error in analysis is assuming that because two things happen together, one caused the other.
- Correlation: A relationship between two pieces of data (e.g., Ice cream sales and Shark attacks both go up in July).
- Causation: One thing causes the other.
- Reality Check: Ice cream does not cause shark attacks. They are correlated because of a third variable: Summer heat.
Section Common Mistakes Review
- Bit Calculation: Students often forget that the first place value is $2^0 (1)$, not $2^1 (2)$. Always start counting from 0 on the right.
- Hexadecimal: While useful for programmers to represent binary groups (e.g., colors), Hexadecimal is not strictly mathematically required on the AP CSP exam anymore, though understanding it is helpful context. Focus on Binary/Decimal.
- Privacy: Students often assume metadata is "safe." It is not. Metadata alone (like time and location of calls) can reveal massive amounts of private information about a person's life.