AP Calculus AB Unit 5 Study Guide: Curve Sketching, Derivative Graph Connections, and Optimization
Connecting %%LATEX0%%, %%LATEX1%%, and Graphs
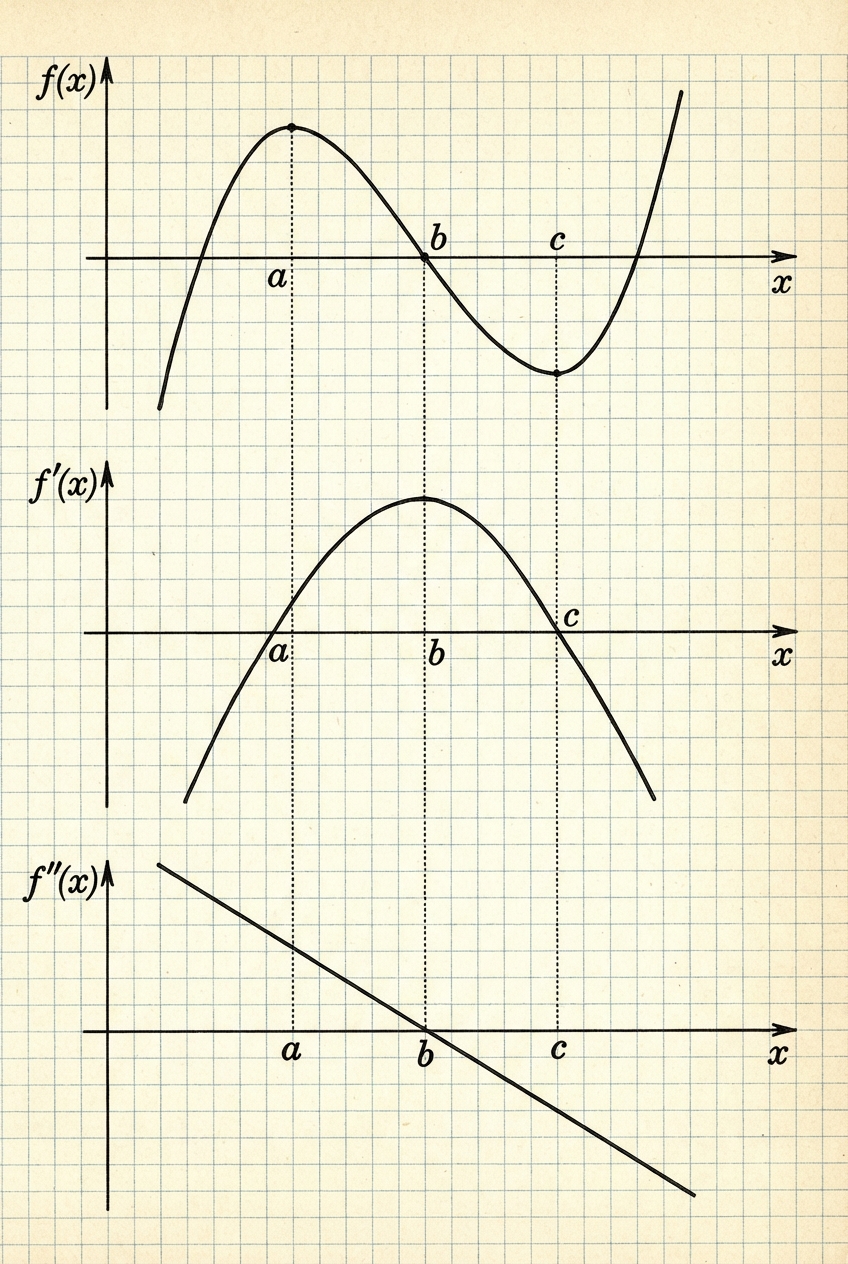
What these graphs represent (and why you should care)
When you take derivatives, you are not just doing an algebraic procedure; you are changing what question the graph answers.
The graph of %%LATEX3%% answers “What is the output value?” (position, height, profit, etc.). The graph of %%LATEX4%% answers “How fast is %%LATEX5%% changing?” (slope, velocity, marginal change). The graph of %%LATEX6%% answers “How is the rate of change changing?” (whether slopes are increasing or decreasing; acceleration; concavity).
A powerful idea in curve sketching is that these three graphs are tightly linked: features you see in one graph force features in the others. On the AP exam, many questions rely more on these conceptual links than on heavy algebra.
The derivative-to-shape dictionary (translation rules)
To successfully analyze these graphs, you must be fluent in the “translation dictionary” between a function %%LATEX7%%, its derivative %%LATEX8%%, and its second derivative .
| Function feature | What to look for in | What to look for in |
|---|---|---|
| Increasing | Not directly linked to sign | |
| Decreasing | Not directly linked to sign | |
| Relative extrema (peak/valley) | %%LATEX17%% or %%LATEX18%% undefined, with a sign change in | Used for the Second Derivative Test when applicable |
| Concave up | is increasing | |
| Concave down | is decreasing | |
| Point of inflection (POI) | Typically corresponds to a local max/min of %%LATEX26%% (where %%LATEX27%% switches from increasing to decreasing or vice versa) | %%LATEX28%% or %%LATEX29%% undefined, with a sign change in |
Increasing/decreasing comes from the sign of
The sign of the derivative is the cleanest way to decide whether rises or falls.
- %%LATEX33%% is increasing on an interval where %%LATEX34%%.
- %%LATEX35%% is decreasing on an interval where %%LATEX36%%.
- %%LATEX37%% is constant (flat) where %%LATEX38%% for all in that interval.
Interpretation: %%LATEX40%% is the slope of %%LATEX41%% at . Positive slope means up; negative slope means down.
Local maxima/minima come from sign changes in
A critical point of %%LATEX44%% is a point where %%LATEX45%% or where %%LATEX46%% is undefined (but %%LATEX47%% is defined). Critical points are where local extrema can occur.
- If %%LATEX48%% changes from positive to negative at %%LATEX49%%, then %%LATEX50%% has a local maximum at %%LATEX51%%.
- If %%LATEX52%% changes from negative to positive at %%LATEX53%%, then %%LATEX54%% has a local minimum at %%LATEX55%%.
- If %%LATEX56%% but the sign does not change, %%LATEX57%% has a plateau (a flat point), not a local extremum.
Why sign change matters: it captures the idea that you were going up before %%LATEX58%% and down after %%LATEX59%% (or vice versa).
Concavity comes from %%LATEX60%% (and from whether %%LATEX61%% increases/decreases)
Concavity describes whether the graph “bends upward” or “bends downward.” A precise way to think about it is: are the slopes increasing or decreasing?
- %%LATEX62%% is concave up where %%LATEX63%% (slopes of are increasing).
- %%LATEX65%% is concave down where %%LATEX66%% (slopes of are decreasing).
Equivalently, since %%LATEX68%% is the derivative of %%LATEX69%%:
- Where %%LATEX70%% is increasing, %%LATEX71%%.
- Where %%LATEX72%% is decreasing, %%LATEX73%%.
Common misconception: concave up does not mean “the function is positive.” It means the slopes are trending upward.
Inflection points come from changes in concavity
An inflection point is a point on where concavity changes (from up to down or down to up).
A typical test:
- If %%LATEX75%% changes sign at %%LATEX76%% (and %%LATEX77%% is continuous there), then %%LATEX78%% has an inflection point at .
Important warning: by itself does not guarantee an inflection point; you must check for a sign change.
How to move between the graphs conceptually (the “bridges”)
These are the mental moves that let you go from one graph to another.
From %%LATEX81%% to %%LATEX82%%
Where %%LATEX83%% has a horizontal tangent, %%LATEX84%%. Where %%LATEX85%% is steeply increasing, %%LATEX86%% is large and positive. Where %%LATEX87%% is steeply decreasing, %%LATEX88%% is large in magnitude and negative. Where %%LATEX89%% changes from concave up to concave down, %%LATEX90%% changes from increasing to decreasing (because changes sign).
A helpful analogy: imagine walking along the graph of %%LATEX92%% from left to right. Your uphill/downhill steepness at each moment is %%LATEX93%%. Whether the steepness itself is getting more uphill or less uphill is .
From %%LATEX95%% to %%LATEX96%%
Where %%LATEX97%%, %%LATEX98%% must be increasing. Where %%LATEX99%%, %%LATEX100%% must be decreasing. Where %%LATEX101%%, %%LATEX102%% has a critical point (possible local extremum). If %%LATEX103%% crosses the axis (sign change), %%LATEX104%% has a local max/min depending on the direction of the sign change.
From %%LATEX105%% to %%LATEX106%%
Because %%LATEX107%% is the derivative of %%LATEX108%%, it measures the slope of the graph.
- Where %%LATEX110%% rises, %%LATEX111%%.
- Where %%LATEX112%% falls, %%LATEX113%%.
- Where %%LATEX114%% has a local max/min, %%LATEX115%% (or undefined).
Visual alignment reminder
When you are given a graph of %%LATEX116%% and asked about %%LATEX117%%, remember that %%LATEX118%% plots the slope of %%LATEX119%%, and the graphs line up vertically by the same -values.
Notation reference (you’ll see multiple styles)
| Meaning | Common notations |
|---|---|
| Derivative of | %%LATEX122%%, %%LATEX123%%, %%LATEX124%% (if %%LATEX125%%) |
| Second derivative of | %%LATEX127%%, %%LATEX128%% |
Example 1: Reading extrema and concavity from derivative sign information
Suppose you know the following about %%LATEX129%% and %%LATEX130%% on an interval:
- %%LATEX131%% on %%LATEX132%% and %%LATEX133%% on %%LATEX134%%.
- %%LATEX135%% on %%LATEX136%% and %%LATEX137%% on %%LATEX138%%.
Because %%LATEX139%% on %%LATEX140%%, %%LATEX141%% is increasing there. Because %%LATEX142%% on %%LATEX143%%, %%LATEX144%% is decreasing there. At %%LATEX145%%, %%LATEX146%% changes from positive to negative, so %%LATEX147%% has a local maximum at %%LATEX148%%.
Because %%LATEX149%% on %%LATEX150%%, %%LATEX151%% is concave down there. Because %%LATEX152%% on %%LATEX153%%, %%LATEX154%% is concave up there. At %%LATEX155%%, %%LATEX156%% changes sign, so %%LATEX157%% has an inflection point at %%LATEX158%%.
Notice how you learned a lot about the shape of without ever knowing an explicit formula.
Example 2: Using an %%LATEX160%% graph to describe %%LATEX161%%
Imagine the graph of %%LATEX162%% is a parabola opening upward that crosses the %%LATEX163%%-axis at %%LATEX164%% and %%LATEX165%%, with its minimum below the axis.
Because %%LATEX166%% for %%LATEX167%% and %%LATEX168%%, %%LATEX169%% is increasing on %%LATEX170%% and %%LATEX171%%. Because %%LATEX172%% on %%LATEX173%%, %%LATEX174%% is decreasing there. Therefore %%LATEX175%% has a local maximum at %%LATEX176%% (sign changes positive to negative) and a local minimum at %%LATEX177%% (sign changes negative to positive).
For concavity: since %%LATEX178%% is the slope of %%LATEX179%%, %%LATEX180%% is concave down where %%LATEX181%% is decreasing (left of the vertex) and concave up where is increasing (right of the vertex).
Exam Focus
Typical question patterns include being given a graph of %%LATEX183%% (or a table of values or signs) and asked where %%LATEX184%% is increasing or decreasing and where %%LATEX185%% has relative extrema. You may also be given a graph of %%LATEX186%% and asked to sketch or describe %%LATEX187%% or %%LATEX188%% qualitatively, or be given sign charts for %%LATEX189%% and %%LATEX190%% and asked for intervals of concavity and inflection points.
Common mistakes include claiming “inflection point at %%LATEX191%% because %%LATEX192%%” without checking that %%LATEX193%% changes sign, mixing up “%%LATEX194%% is increasing” with “%%LATEX195%% is positive,” declaring a max/min whenever %%LATEX196%% without verifying a sign change, and mixing up which graph you are looking at. A particularly common error is identifying peaks of %%LATEX197%% as maximums of %%LATEX198%%; those peaks are (when concavity changes) the inflection points of . Always label axes and ask: “Am I looking at position, slope, or concavity?”
Sketching Graphs of Functions and Their Derivatives
The goal: a shape-accurate sketch, not a perfect picture
In AP Calculus AB, “sketch” usually means you capture the key behaviors: where the graph rises or falls, where it flattens, where it bends up or down, and where it has corners or cusps. Curve sketching combines limits, derivatives, and algebra to draw an accurate representation of a function without relying on a calculator. While AP exams often focus on analyzing given graphs, you may also be asked to sketch a curve satisfying specific criteria.
A good sketch is guided by non-negotiable rules: %%LATEX200%% is the slope of %%LATEX201%%, %%LATEX202%% is the slope of %%LATEX203%% and controls concavity of %%LATEX204%%, and nondifferentiable points on %%LATEX205%% (corners, cusps, vertical tangents, discontinuities) usually mean is undefined there.
The curve sketching verification list (finding anchors first)
Before determining the “derivative-based shape,” first collect the anchors of the original function.
- Domain and discontinuities: identify vertical asymptotes (often where a denominator equals zero) and holes.
- Intercepts: evaluate the y-intercept using %%LATEX207%% and find x-intercepts by solving %%LATEX208%%.
- End behavior: use limits at infinity to locate horizontal asymptotes.
- Symmetry: check even symmetry
or odd symmetry
These steps help you avoid sketches that have the right “calculus shape” but the wrong overall behavior.
The sign chart method (turn derivatives into shape)
Once anchors are found, use derivatives to determine increasing/decreasing and concavity.
- Find critical points by solving %%LATEX213%% and also noting where %%LATEX214%% is undefined.
- Make a sign chart for %%LATEX215%% by testing intervals between critical points to determine where %%LATEX216%% increases or decreases.
- Find possible inflection points by solving %%LATEX217%% and also noting where %%LATEX218%% is undefined.
- Make a sign chart for by testing intervals to determine concavity.
How to sketch %%LATEX220%% from a graph of %%LATEX221%% (qualitative method)
When you’re given the graph of %%LATEX222%%, build %%LATEX223%% by thinking about slopes.
- Mark where %%LATEX224%% has horizontal tangents. At these %%LATEX225%%-values, %%LATEX226%%, so %%LATEX227%% crosses or touches the -axis there.
- Determine where %%LATEX229%% is increasing or decreasing. Increasing means %%LATEX230%% (draw %%LATEX231%% above the axis). Decreasing means %%LATEX232%%.
- Estimate relative steepness. Where %%LATEX233%% is steep, %%LATEX234%% is large; where %%LATEX235%% is nearly flat, %%LATEX236%% is near zero.
- Use concavity of %%LATEX237%% to shape %%LATEX238%%. If %%LATEX239%% is concave up, slopes are increasing, so %%LATEX240%% should be increasing. If %%LATEX241%% is concave down, %%LATEX242%% should be decreasing.
- Handle corners, cusps, and vertical tangents. At a corner or cusp (sharp change in slope), %%LATEX243%% is typically undefined. At a vertical tangent, slopes blow up to infinity in magnitude, so %%LATEX244%% may approach very large positive or negative values.
How to sketch %%LATEX245%% from %%LATEX246%% (reconstruct behavior)
If you’re given %%LATEX247%%, you cannot determine the exact vertical position of %%LATEX248%% (many functions share the same derivative up to an added constant). But you can determine the overall shape.
- Use the sign of %%LATEX249%% to make %%LATEX250%% rise or fall.
- Use where %%LATEX251%% (or undefined) to locate turning-point candidates of %%LATEX252%%.
- Use whether %%LATEX253%% is increasing or decreasing to decide concavity of %%LATEX254%% (this is the sign of ).
If an initial condition is provided (for example, ), you can anchor the vertical shift.
How to sketch %%LATEX257%% from %%LATEX258%%
Since %%LATEX259%% is the derivative of %%LATEX260%%, it is “a graph of the slopes” of .
- Where %%LATEX262%% rises, %%LATEX263%%.
- Where %%LATEX264%% falls, %%LATEX265%%.
- Where %%LATEX266%% has a local extremum, %%LATEX267%% (if differentiable).
Example 1: Sketching %%LATEX268%% from a piecewise-linear %%LATEX269%%
Suppose is drawn as straight line segments:
- From %%LATEX271%% to %%LATEX272%%, %%LATEX273%% is a line increasing with constant slope %%LATEX274%%.
- From %%LATEX275%% to %%LATEX276%%, %%LATEX277%% is a line decreasing with constant slope %%LATEX278%%.
- At there is a sharp corner.
On each straight segment, slope is constant, so is constant on each interval:
- %%LATEX281%% for %%LATEX282%%.
- %%LATEX283%% for %%LATEX284%%.
- %%LATEX285%% is undefined at %%LATEX286%%.
A correct sketch of %%LATEX287%% would be two horizontal lines (one at height %%LATEX288%% on %%LATEX289%% and one at height %%LATEX290%% on %%LATEX291%%) with an open circle or break at %%LATEX292%%.
Common trap: students draw %%LATEX293%% as a slanted line because %%LATEX294%% is slanted. But is a number-valued function giving slope, and constant slope means a horizontal line.
Example 2: Sketching %%LATEX296%% from a graph of %%LATEX297%%
Suppose %%LATEX298%% is an increasing line that crosses the %%LATEX299%%-axis at %%LATEX300%%. For %%LATEX301%%, %%LATEX302%% so %%LATEX303%% is decreasing. For %%LATEX304%%, %%LATEX305%% so %%LATEX306%% is increasing. Therefore, %%LATEX307%% has a local minimum at .
Because %%LATEX309%% is increasing everywhere, %%LATEX310%% everywhere, so %%LATEX311%% is concave up everywhere. That means the local minimum at %%LATEX312%% looks like the bottom of a bowl rather than a sharp point.
If you’re also told , then you can place the minimum point at
and sketch an upward-opening, concave-up curve decreasing into that point and increasing out of it.
Example 3: Sketching a polynomial using derivatives
Consider
Intercepts come from factoring:
So the x-intercepts include %%LATEX317%% and %%LATEX318%%, giving intercept points %%LATEX319%% and %%LATEX320%%.
Compute the first derivative:
Factor:
Critical points occur at %%LATEX323%% and %%LATEX324%%. Using a sign chart idea, %%LATEX325%% goes positive to negative to positive, so %%LATEX326%% increases, then decreases, then increases. Therefore %%LATEX327%% has a relative maximum at %%LATEX328%% and a relative minimum at .
Compute the second derivative:
A possible point of inflection occurs at %%LATEX331%%. Since %%LATEX332%% goes negative to positive, %%LATEX333%% is concave down then concave up, so there is a point of inflection at %%LATEX334%%.
What goes wrong most often in sketching
A high point on %%LATEX335%% does not mean %%LATEX336%% is high; at a local maximum, %%LATEX337%% is usually %%LATEX338%%. Also, derivatives can be undefined: a corner on %%LATEX339%% means %%LATEX340%% does not exist at that %%LATEX341%%, even though %%LATEX342%% is perfectly defined there. Finally, “concave up” is not the same as “above the axis”; concavity is about how slope changes.
Exam Focus
Typical question patterns include sketching %%LATEX343%% from a graph of %%LATEX344%% with clear increasing/decreasing and concavity regions (often including corners), using a graph of %%LATEX345%% to determine where %%LATEX346%% increases/decreases and where %%LATEX347%% is concave up/down (and sometimes sketching %%LATEX348%% up to a vertical shift), and using %%LATEX349%% or %%LATEX350%% to identify the -coordinates of relative extrema or inflection points.
Common mistakes include putting zeros of %%LATEX352%% at the same %%LATEX353%%-values as zeros of %%LATEX354%% (intercepts vs horizontal tangents), drawing %%LATEX355%% as continuous across a corner of %%LATEX356%% (corners typically create a break because the derivative is undefined), ignoring the effect of concavity when shaping %%LATEX357%% (or shaping %%LATEX358%% from %%LATEX359%%), and confusing “defined” with “zero” (extrema can occur where is undefined).
Optimization Problems
What optimization is (and why calculus is the right tool)
An optimization problem asks you to find the maximum or minimum value of some quantity (area, cost, time, distance, profit) subject to constraints.
Calculus matters because maxima and minima often occur at critical points, where the instantaneous rate of change is zero. Intuitively: if you’re at the highest point of a hill, the slope at that exact point is flat.
In AP Calculus AB, most optimization problems are single-variable: you use the constraint(s) to write everything in terms of one variable, then use derivatives to locate extrema.
The calculus principle behind optimization
If a function %%LATEX361%% is continuous on a closed interval %%LATEX362%%, then it attains an absolute maximum and absolute minimum somewhere on that interval (Extreme Value Theorem).
To find absolute extrema on , you check:
- critical points where %%LATEX364%% or %%LATEX365%% is undefined (inside the interval)
- endpoints %%LATEX366%% and %%LATEX367%%
Then compare the function values.
A reliable setup process (translating words into calculus)
Most optimization errors happen before differentiating, during modeling. A strong process prevents that.
- Visualize: draw a picture and label known and unknown quantities.
- Primary equation: write the formula for the quantity you want to maximize/minimize (the objective function).
- Constraint: write an equation that relates the variables (fixed perimeter, fixed volume, limited fencing, etc.).
- Substitution: use the constraint to rewrite the objective function in terms of one single variable.
- Domain: determine the feasible interval (or inequality constraints) for that variable.
- Calculus: differentiate, set the derivative equal to zero (and note where it’s undefined), then justify the optimum.
First Derivative Test vs Second Derivative Test
The First Derivative Test is conceptual and works even when %%LATEX369%% is messy: if %%LATEX370%% changes from positive to negative at a critical point, you have a local max; if negative to positive, a local min.
The Second Derivative Test is faster when it applies: if %%LATEX371%% and %%LATEX372%% then local min; if %%LATEX373%% then local max. It requires %%LATEX374%% to be conclusive.
The Candidates Test (closed interval method)
If the problem implies a closed interval (for example, must be between 0 and 10), you must use the Candidates Test to justify your answer.
- Find critical numbers %%LATEX376%% inside %%LATEX377%%.
- Evaluate the objective function at the endpoints and at each critical number.
- Compare values: the largest is the absolute maximum, and the smallest is the absolute minimum.
Example 1: Maximize area with a fixed perimeter (classic rectangle)
Problem: A rectangle has perimeter 40 units. What dimensions maximize its area?
Let width be %%LATEX378%% and length be %%LATEX379%%. The area is
The perimeter constraint is
Solve for :
Write area in one variable:
Simplify:
Domain: for a real rectangle, .
Differentiate:
Set equal to zero:
So
Then
Confirm it’s a maximum:
Since %%LATEX392%%, the area is maximized at %%LATEX393%%.
Conclusion: the rectangle with maximum area is a square, %%LATEX394%% by %%LATEX395%%.
What can go wrong: forgetting to check that the critical point lies in the domain, or forgetting that perimeter uses both pairs of sides.
Example 2: Minimize surface area of a closed cylinder with fixed volume
Problem: A closed cylinder (top and bottom) has volume cubic units. Find the radius and height that minimize surface area.
Let radius be %%LATEX397%% and height be %%LATEX398%%. Surface area of a closed cylinder:
Volume constraint:
Given
Divide by :
Solve for :
Substitute into :
Simplify:
Domain: .
Differentiate:
Set equal to zero:
Divide by :
So
Thus
Therefore
Now find :
So
A helpful simplification is
Verify it’s a minimum:
For %%LATEX422%%, %%LATEX423%%, so the critical point gives a minimum.
Conclusion: surface area is minimized when , with
and
Modeling note: many students forget the cylinder is closed and omit the term. That changes the optimization completely.
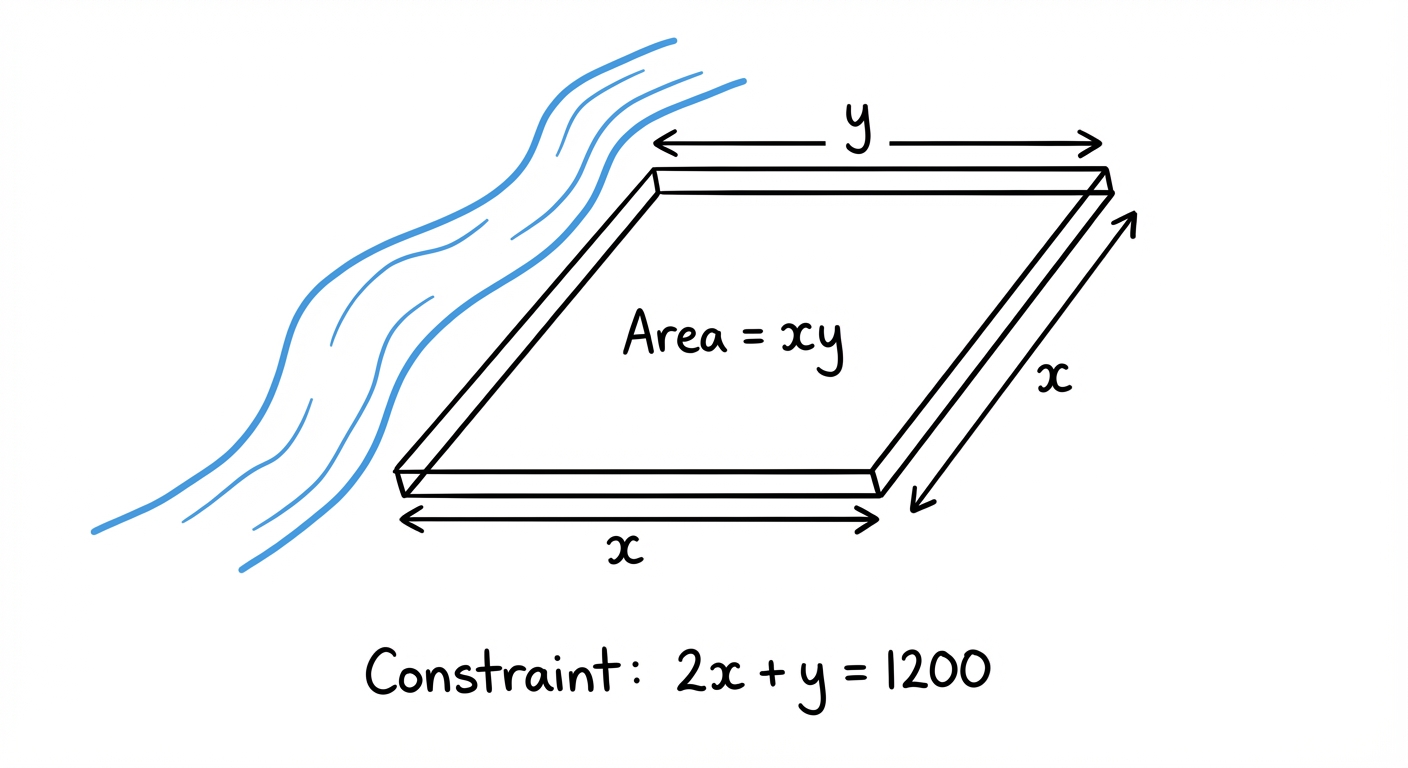
Example 3: Fencing a rectangular pasture along a river
Problem: A farmer has 1200 meters of fencing and wants to enclose a rectangular plot that borders a straight river. No fencing is needed along the river. What dimensions maximize the area?
Let %%LATEX428%% be the side perpendicular to the river, and %%LATEX429%% be the side parallel to the river (the side opposite the river). Objective function:
Constraint (two perpendicular sides plus the far side need fencing):
Solve for :
Substitute into area:
Simplify:
Domain: require %%LATEX436%% and %%LATEX437%%. If %%LATEX438%%, then %%LATEX439%%, so
Differentiate:
Set equal to zero:
So
Candidates Test (must check endpoints for a closed interval):
So
Conclusion: %%LATEX448%% m and %%LATEX449%% m yield the maximum area of square meters.
Interpreting and justifying answers (a frequent AP scoring focus)
Even if your calculus is correct, you can lose points if you don’t interpret the result.
State what your variable represents, give units when relevant, and if asked for dimensions, give all requested dimensions (not just the variable you optimized). Clearly indicate whether you found a maximum or a minimum and why (sign change, second derivative, or endpoint comparison).
Exam Focus
Typical question patterns include “find the dimensions of a shape that maximize area/minimize cost given a fixed perimeter/area/volume,” translating a word problem into an objective function plus a constraint and reducing to one variable, and optimization on a closed interval where endpoints must be checked along with critical points.
Common mistakes include not reducing to one variable before differentiating, forgetting domain restrictions (allowing negative lengths or ignoring that a variable must be within an interval), finding a critical point and stopping without justification, and forgetting optimization endpoints (the optimum can occur at an endpoint on a closed interval). Also remember that critical points include places where %%LATEX451%% is undefined (not only where %%LATEX452%%).