AP Macroeconomics Unit 4 (Financial Sector): Financial Assets, Money & Banking, Money Market, Monetary Policy, and Loanable Funds
Financial Assets, Interest Rates, and Why the Financial Sector Matters
The financial sector is the part of the economy that channels saving into investment. Households, firms, governments, and foreigners all decide whether to spend now or later, and financial markets connect people with funds to lend (savers) to those who want funds to borrow (spenders/investors). In Unit 4, you study how this system determines interest rates, how banks create money, and how the central bank (the Federal Reserve) uses monetary policy to influence inflation, output, and employment.
A financial asset is a claim on future payments. When you buy a financial asset, you give up money today in exchange for expected benefits later (interest, dividends, repayment of principal). A key idea is that financial investments yield a rate of return, and decision-makers compare returns across options.
A firm invests in a physical asset (machines, buildings, equipment) if the expected rate of return on that investment is at least as high as the real interest rate (the opportunity cost of using funds elsewhere).
Key terms used across Unit 4
Liquidity is the ease with which a financial asset can be accessed and converted into cash. Cash is the most liquid asset.
A rate of return is the net gain or loss of an investment over a specified period. All else equal, people prefer investments with higher expected returns.
Risk is the chance that an investment’s actual gains differ from the expected outcome.
Common financial assets in AP Macro
Bank deposits are the money in your bank account. A checking account (also called a demand deposit) is highly liquid and can typically be used whenever you want (for example, with a debit card). These deposits are assets for depositors but liabilities for banks because the bank owes depositors the funds.
Loans are borrowing arrangements where money is repaid with interest (example: credit cards). From the lender’s perspective, the loan is a financial asset because it is a claim on repayment.
Stocks are certificates representing ownership in a firm.
- Stock (equity): a claim to a share of ownership.
- Equity financing: raising funds by issuing shares of stock to the public.
Bonds are certificates of indebtedness from an issuer to a bondholder.
- A firm can issue corporate bonds to raise money: the bond promises repayment of the principal plus interest, often on a specific date. This is debt financing.
- Debt financing: raising investment funds by issuing bonds to the public.
- Bonds can be bought and sold in a secondary market.
Interest rates as incentives
The interest rate is the “price” of borrowing money: the percentage return paid to the lender (and cost to the borrower). Think of the interest rate like a rental price for money. When interest rates are high, borrowing is less attractive and saving is more rewarded; when interest rates are low, borrowing becomes more attractive and saving is less rewarded.
Interest rates matter because they influence consumption and saving, firm investment, net exports through exchange-rate channels (covered more in the open economy unit), and therefore aggregate demand (AD), output, and inflation.
Bonds and the interest rate (inverse relationship)
A relationship tested constantly: bond prices and interest rates move in opposite directions.
Bonds typically pay fixed interest payments. When market interest rates rise, newly issued bonds offer higher returns, so older bonds with lower fixed payments become less desirable. Their price falls until the effective return matches the market. When market interest rates fall, existing bonds with higher fixed payments become more attractive and their price rises.
People generally prefer higher interest rates because they imply a greater return, which is part of why older fixed-payment bonds lose value when rates rise.
A simple present value idea (useful intuition)
Financial assets are valued by discounting future payments. When the interest rate rises, future payments are discounted more heavily, so present values fall.
If %%LATEX1%% increases, %%LATEX2%% decreases. This gives you another way to explain why higher interest rates tend to push down prices of assets promising fixed future payments.
Exam Focus
- Typical question patterns:
- Explain why bond prices fall when interest rates rise (or vice versa).
- Identify who gains/loses from unexpected interest rate changes (borrowers vs. lenders).
- Decide whether a firm undertakes an investment when given an expected return and a real interest rate.
- Common mistakes:
- Saying bond prices and interest rates move together (they move oppositely).
- Confusing “deposit as an asset” (for households) with “deposit as a liability” (for banks).
- Treating quoted interest rates as automatically real rates; many contexts use nominal unless stated.
Nominal vs. Real Interest Rates and the Fisher Equation
In real life, the interest rate you see quoted (credit cards, mortgages, Treasury bonds) is usually a nominal interest rate, measured in dollars and not adjusted for inflation. For decision-making, what matters is the real interest rate, which measures the purchasing-power return.
Definitions
- Nominal interest rate: not adjusted for inflation; reflects current market conditions and the price of money in dollar terms.
- Real interest rate: adjusted for inflation; measures how much purchasing power a lender actually earns (and a borrower actually pays).
Fisher equation (AP version)
AP Macro uses the Fisher relationship linking nominal rates, real rates, and expected inflation:
Rearranged:
This is typically treated as an approximation at the AP level.
Why expected vs. actual inflation matters
Loan and bond contracts are agreed upon in advance, so nominal interest rates tend to reflect expected inflation. If inflation turns out higher than expected, the lender’s realized real return is lower than planned and the borrower benefits (repaying with “cheaper” dollars). If inflation is lower than expected, lenders benefit and borrowers lose.
Example: nominal vs. real
If a loan has a nominal interest rate of 7% and expected inflation is 3%:
The real interest rate is about 4%.
Predictions: positive vs. negative real interest rates
When nominal interest rates are higher than inflation, real interest rates are positive; when nominal interest rates are lower than inflation, real interest rates are negative.
A positive real interest rate means savers gain purchasing power over time. A negative real interest rate means savers lose purchasing power on interest-bearing assets, but borrowing can become unusually attractive. For example, negative real rates can encourage borrowing for homes (raising housing demand and prices) and can make businesses more willing to finance projects or acquisitions. At the same time, conservative investors may face tough choices about where to put their money.
Exam Focus
- Typical question patterns:
- Calculate the real interest rate given a nominal interest rate and expected inflation.
- Predict what happens to nominal interest rates when expected inflation increases.
- Identify who benefits when actual inflation differs from expected inflation.
- Determine whether real interest rates are positive or negative given nominal rates and inflation.
- Common mistakes:
- Using actual inflation when the prompt emphasizes expectations.
- Claiming higher inflation automatically raises real interest rates (it mainly raises nominal rates, holding real rates constant).
What Money Is (and Isn’t): Types, Functions, Characteristics, and Measures
In macroeconomics, money is anything widely accepted as payment for goods and services and to settle debts. This is narrower than “wealth” or “income.”
Types of money
Fiat money is the paper and coin money used today. It has no intrinsic value and is backed by public trust that the government maintains its value.
Commodity money performs the function of money and has an alternative non-monetary use (examples: tobacco, silver, gold, oil, and other precious metals).
The functions of money
Money serves three functions:
- Medium of exchange: used to buy and sell, avoiding barter’s “double coincidence of wants” problem.
- Unit of account: provides a common measure for prices and relative values.
- Store of value: transfers purchasing power into the future. It tends to work best when inflation is low, since high inflation erodes stored purchasing power.
A helpful medium-of-exchange story is the “chain” idea: your labor hours become money; money buys apples; the farmer uses money to buy inputs; and so on.
Characteristics of good money
Good money tends to be durable, portable, divisible, uniform, limited in supply (scarce), and acceptable (trusted).
Money vs. wealth
A frequent confusion is treating wealth as money. A house is wealth but not money because it is not widely accepted as payment. Stocks and bonds are financial assets and forms of wealth, but they are not money.
Measures of the money supply (M1 and M2)
The money supply is the quantity of money in circulation as measured by the Federal Reserve, commonly using M1 and M2. In the standard AP money market model, the money supply is treated as fixed at a point in time, so the money supply curve is vertical.
M1 is the most liquid definition and the basis for broader measures:
- Currency (cash and coins)
- Checking deposits (demand deposits)
- Traveler’s checks
M2 is broader and less liquid:
- M1
- Savings deposits
- Small time deposits
- Money market deposit accounts
- Money market mutual funds
Monetary base (also called M0 or MB)
The monetary base is:
This matters because reserves are the foundation for deposit expansion in fractional reserve banking. Reserves themselves are not counted in measures like M1, but currency in circulation is. One practical intuition: paying a debt with physical cash is a direct use of base money, while using a credit card is not (it’s a loan transaction rather than final settlement with currency/reserves).
Exam Focus
- Typical question patterns:
- Classify an item as part of M1, M2, or neither.
- Identify fiat vs. commodity money from examples.
- Explain the three functions of money in a scenario.
- Distinguish money from wealth or income.
- Common mistakes:
- Calling stocks/bonds “money” (they are financial assets, not money).
- Forgetting traveler’s checks in M1 or including highly illiquid items as “money.”
- Treating M2 items as equally liquid as M1 (they are less liquid).
The Banking System: Balance Sheets, Reserves, and Fractional Reserve Banking
Banks are financial intermediaries that accept deposits and make loans. This is central to how modern economies expand the money supply.
Balance sheets and T-accounts
A balance sheet lists what an institution owns and owes:
- Assets: resources owned or owed to the bank (reserves, loans, securities).
- Liabilities: obligations (customer deposits and bank borrowing).
- Net worth (bank capital): assets minus liabilities.
A simplified commercial bank balance sheet looks like this:
| Bank Balance Sheet | ||
|---|---|---|
| Assets | Liabilities | |
| Reserves | Deposits | |
| Loans | Borrowing (if any) | |
| Securities | Bank capital (net worth) |
A key insight: your deposit is your asset, but it is the bank’s liability.
Fractional reserve banking and reserve concepts
Fractional reserve banking is a system in which only a fraction of total deposits is held in reserve as currency/reserves.
The reserve ratio (often treated in AP as the required reserve ratio) is the fraction of deposits kept as reserves. It can be expressed as:
The reserve requirement is the regulation set by the Fed stating the minimum reserve ratio banks must hold.
Banks hold:
- Required reserves: the minimum amount needed.
- Excess reserves: reserves held above the required minimum.
If the required reserve ratio is %%LATEX9%% and checkable deposits are %%LATEX10%%:
How banks create money (deposit creation)
When a bank makes a loan, it typically credits the borrower’s checking account rather than handing over currency. That new deposit is spendable and counted in the money supply. In this simplified AP model, new loans create new deposits, expanding the money supply.
Banks are not unconstrained. In AP-style problems, the main formal constraint is reserves/requirements. In the real world, lending is also constrained by profitability, risk, and borrowers’ willingness to take loans.
Worked T-account example (deposit and required reserves)
Example scenario (often tested): Katie takes 1,000 dollars from under her mattress and deposits it at a bank (ECB) into a checking account. If the required reserve ratio is 10%, the bank must keep at least 100 dollars as required reserves:
The remaining 900 dollars are excess reserves, which can be held as excess reserves or lent out.
A related, equally common setup: if you deposit 1,000 dollars into Bank A with a 10% required reserve ratio, reserves rise by 1,000 and deposits rise by 1,000; the bank can lend up to 900 (initially), assuming it lends out all excess reserves.
A common reasoning trap
Students often say “banks lend out reserves.” A better AP-safe phrasing is: banks create deposits when they lend, but the reserve requirement (in the simplified model) limits how much deposit expansion is possible.
Exam Focus
- Typical question patterns:
- Interpret a bank balance sheet/T-account and classify assets vs. liabilities.
- Compute required reserves and excess reserves given deposits and .
- Explain in words how loans create deposits (money creation).
- Common mistakes:
- Treating deposits as bank assets (they are liabilities).
- Assuming a bank can lend the full deposit amount (it must keep required reserves).
- Confusing “reserve ratio” as a choice vs. “reserve requirement” as the mandated minimum.
The Money Multiplier and Deposit Expansion (What AP Means by “Creating Money”)
In the idealized AP model (banks lend all excess reserves, no cash leakages, and borrowers redeposit funds), deposit expansion happens in multiple rounds: one bank lends excess reserves; the loan becomes someone else’s deposit; that deposit supports another loan; and so on.
Money multiplier formula
The money multiplier measures the maximum amount of new checking deposits that can be created by a single dollar of excess reserves:
If new reserves increase by , the maximum change in the money supply is:
Worked example: multiplier
If , then:
If reserves rise by , then:
Reverse-engineering the reserve ratio
If the multiplier is 10:
Why the actual multiplier can be smaller
The multiplier is a maximum, not a guarantee. It becomes smaller if:
- Banks keep more than the required dollars in reserve (hold excess reserves).
- Borrowers do not redeposit all funds into the bank and instead keep some as cash.
- Customers are not willing to borrow at the current interest rate.
Exam Focus
- Typical question patterns:
- Compute the money multiplier given a required reserve ratio.
- Compute maximum %%LATEX22%% from a given %%LATEX23%%.
- Infer from a stated multiplier or maximum change.
- Common mistakes:
- Applying the multiplier to the wrong starting point (many Fed problems use , not the initial customer deposit).
- Forgetting the word “maximum” and adding realistic complications the prompt does not imply.
The Money Market (Liquidity Preference): Money Demand, Money Supply, and the Nominal Interest Rate
The money market model (liquidity preference) explains how the nominal interest rate is determined by money demand and money supply. This model is central because it links Fed actions to interest rates and then to investment and aggregate demand.
Demand for money: transaction demand + asset demand
Money demand is the desire to hold wealth in liquid form (cash/checking) rather than interest-bearing assets like bonds. The opportunity cost of holding money is the interest you could have earned.
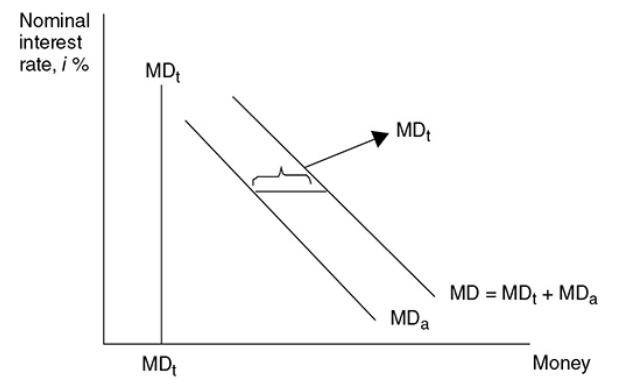
Money demand has two standard components:
- Transaction demand: money held to conduct transactions. It is not related to the interest rate, but it increases as nominal GDP increases.
- Asset demand: money held as an asset. As nominal interest rates rise, the opportunity cost of holding money rises, so asset demand for money falls.
When you add the constant transaction demand (often drawn as a fixed amount) to a downward-sloping asset demand curve, you get the total money demand curve, which is downward sloping in the nominal interest rate.
Transaction-demand example using velocity: If nominal GDP is 1,000 and each dollar is spent an average of four times per year, transaction money demand is:
If nominal GDP rises to 1,200:
Shifters of money demand
Money demand can shift due to:
- Price level
- Real GDP
- Transaction costs
For instance, higher real GDP typically increases transaction needs and shifts money demand right.
Supply of money
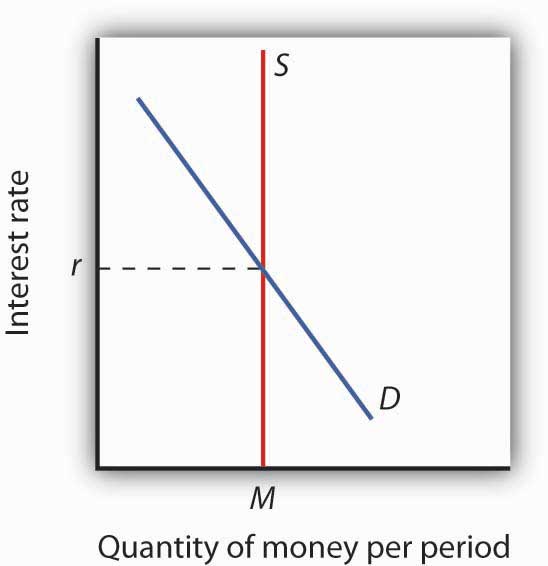
In the AP money market graph, the money supply is vertical because it is set by the Fed (through control of the monetary base and banking conditions) and is independent of the nominal interest rate at a given moment.
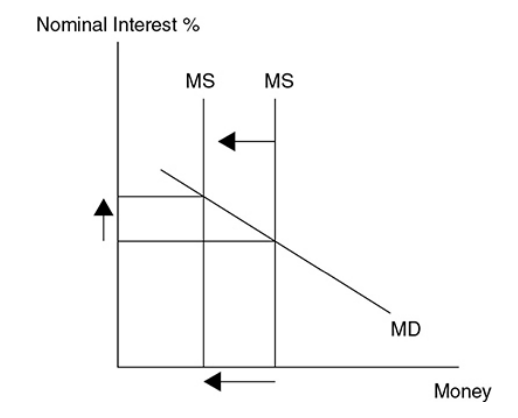
Money market equilibrium
Money market equilibrium occurs at the nominal interest rate where quantity of money demanded equals quantity of money supplied.
(Images from the original notes)
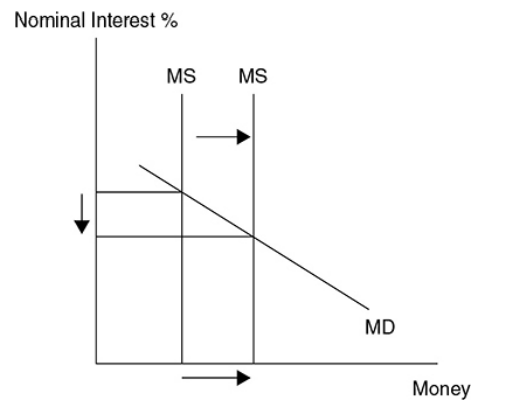
A key chain to AD
When the Fed increases the money supply, the equilibrium nominal interest rate falls, which tends to raise interest-sensitive spending, especially investment. That shifts AD to the right.
Exam Focus
- Typical question patterns:
- Draw/interpret the money market graph after a change in money supply.
- Explain what happens to nominal interest rates when real GDP or price level changes (money demand shifts).
- Use transaction demand logic (nominal GDP and velocity) to compute money needed for transactions.
- Common mistakes:
- Mixing up a movement along money demand (from an interest rate change) with a shift (from GDP/price level/transaction costs changes).
- Confusing the money market (nominal interest rate) with loanable funds (real interest rate).
- Drawing the money supply curve as upward sloping instead of vertical.
The Federal Reserve and Monetary Policy Tools
The Federal Reserve (Fed) is the central bank of the United States. In AP Macroeconomics, its job is to conduct monetary policy: changing the money supply and influencing interest rates to achieve macro goals.
The Fed’s macro goals (AP emphasis)
AP Macro emphasizes goals such as:
- Low and stable inflation
- High employment
- Stable economic growth
Structure you need conceptually
The Fed has a central governing body (Board of Governors) and a network of regional Federal Reserve Banks. The exam usually focuses less on institutional trivia and more on how Fed actions affect reserves, interest rates, and the macroeconomy.
The Fed’s balance sheet (why OMOs work)
A core mechanism is that the Fed buys and sells financial assets (usually government securities). When the Fed buys securities, it pays by creating reserves, increasing the monetary base and enabling money supply expansion through banks. When it sells, it removes reserves.
Types of monetary policy
Expansionary monetary policy is designed to fix a recession by lowering interest rates to increase aggregate demand, lower unemployment, and increase real GDP (often increasing the price level).
Contractionary monetary policy is designed to avoid inflation by increasing interest rates to decrease aggregate demand, lowering the price level and moving real GDP back toward full employment.
(Images from the original notes)
Tools of monetary policy
AP Macro traditionally emphasizes three tools, and many courses also include a fourth modern tool:
Tool 1: Open market operations (OMOs)
OMOs are the Fed’s purchases and sales of government securities.
- Open market purchase: Fed buys securities, bank reserves rise, money supply can expand, and interest rates tend to fall.
- Open market sale: Fed sells securities, bank reserves fall, money supply can contract, and interest rates tend to rise.
Mnemonic (from the notes):
- BB = BB: Buying Bonds = Bigger Bucks
- SB = SB: Selling Bonds = Smaller Bucks
Example using the multiplier: if the Fed buys 100 of government securities and :
Tool 2: Reserve requirement (required reserve ratio)
Changing changes how much lending/deposit expansion the system can support.
- Lower : increases the multiplier; tends to increase the money supply.
- Higher : decreases the multiplier; tends to decrease the money supply.
This tool is powerful but used less frequently in practice because abrupt changes can disrupt banking.
Tool 3: Discount rate
The discount rate is the interest rate banks pay on short-term loans from the Fed.
- Lower discount rate: banks borrow more reserves, reserves increase, money supply increases, interest rates tend to fall.
- Higher discount rate: banks borrow fewer reserves, reserves decrease, money supply decreases, interest rates tend to rise.
Tool 4: Interest on reserves (IOR)
The Fed can pay interest on reserves. If IOR rises, banks have more incentive to hold reserves rather than lend.
- Higher IOR: banks hold more reserves, lend less, money supply growth slows, interest rates tend to rise.
- Lower IOR: banks lend more, money supply tends to rise, interest rates tend to fall.
The federal funds rate and the FOMC
The federal funds rate is the interest rate paid on short-term loans made from one bank to another. It is a key target for OMOs.
- If the FOMC wants to lower interest rates, it buys bonds.
- If the FOMC wants to raise interest rates, it sells bonds.
Exam Focus
- Typical question patterns:
- Choose the appropriate tool and direction for recession vs. inflation.
- Explain how OMOs change reserves first, then affect the money supply and interest rates.
- Use the federal funds rate target to infer whether the Fed is buying or selling securities.
- Common mistakes:
- Confusing fiscal policy (Congress/President) with monetary policy (Fed).
- Mixing up purchase vs. sale (purchase increases reserves; sale decreases reserves).
- Claiming the Fed directly sets all interest rates (it targets very short-term rates; broader rates respond).
Putting It All Together: Monetary Policy, Interest Rates, Investment, and AD-AS
Unit 4 is ultimately about using banks and interest rate models to explain short-run macroeconomic outcomes.
The transmission mechanism (step by step)
The standard AP monetary transmission mechanism is:
- The Fed changes reserves and/or the money supply (often via OMOs).
- Short-term nominal interest rates change (money market).
- Interest-sensitive spending changes, especially investment (and often interest-sensitive consumption).
- Aggregate demand shifts.
- Real output and the price level change in the short run (AD-AS).
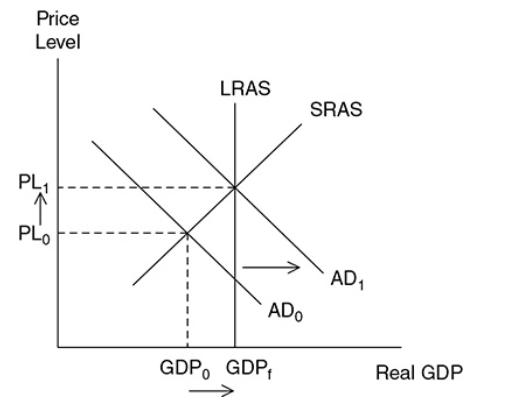
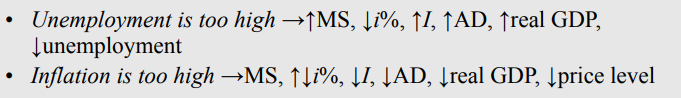
Expansionary monetary policy in a recession
In a recession (real GDP below full employment), expansionary policy typically means:
- Fed buys securities (or lowers discount rate, lowers IOR, lowers reserve requirement)
- Reserves rise
- Money supply rises
- Nominal interest rates fall
- Investment rises
- AD shifts right
- Real GDP rises and unemployment falls in the short run (with the price level often rising as well)
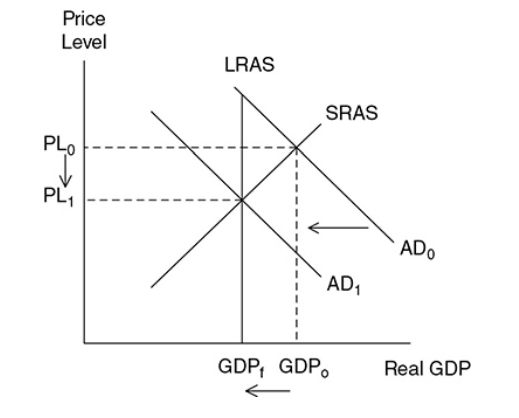
Contractionary monetary policy during inflation
During high inflation/overheating:
- Fed sells securities (or raises discount rate, raises IOR, raises reserve requirement)
- Reserves fall
- Money supply falls
- Nominal interest rates rise
- Investment falls
- AD shifts left
- Real GDP falls in the short run and inflationary pressure eases
Timing, lags, and context
Monetary policy works with lags: interest rate changes take time to affect borrowing, spending, and production. Also, “money supply up” does not automatically mean “inflation instantly.” If the economy has substantial unemployed resources, output may rise more than the price level; near full employment, price level effects are stronger.
Policy conflicts under supply shocks
If the economy experiences cost-push inflation (SRAS shifts left), the Fed faces a tradeoff: contractionary policy lowers inflation but worsens unemployment; expansionary policy raises output but worsens inflation. AD-based tools do not fix the underlying supply shock.
Exam Focus
- Typical question patterns:
- Given a scenario (recession/inflation), recommend expansionary or contractionary monetary policy and trace effects through interest rates, investment, AD, and outcomes.
- Explain why the same monetary policy can have different inflation/output results depending on the starting point (deep recession vs. near full employment).
- Interpret multi-step chains and identify a broken link.
- Common mistakes:
- Skipping steps (jumping from money supply to AD without the interest rate/investment channel).
- Treating contractionary policy as “good” or “bad” rather than describing its tradeoffs (lower inflation, higher unemployment in short run).
The Loanable Funds Market: Real Interest Rates, Saving, Investment, and Crowding Out
The loanable funds market explains how the real interest rate is determined by the supply of saving and the demand for borrowing. It is especially useful for fiscal policy and long-run capital formation discussions.
What is being traded?
The “good” is loanable funds (resources available for lending). The “price” is the real interest rate, because lenders and borrowers ultimately care about purchasing power.
Demand for loanable funds
Demand is the quantity of credit wanted at each real interest rate by borrowers (firms, households, government). The relationship between the real interest rate and quantity demanded is inverse.
Shifters of demand (mnemonic from the notes: F A D E):
- F: Foreign demand for domestic currency
- A: All borrowing, lending, and credit conditions
- D: Deficit spending
- E: Expectations for the future
Supply of loanable funds
Supply is the quantity of credit provided at each real interest rate by banks and other lenders. The relationship between the real interest rate and quantity supplied is positive.
Determinants of supply (mnemonic from the notes: S E L F):
- S: Savings rate
- E: Expectations for the future
- L: Lending at the discount window
- F: Foreign purchases of domestic assets
Equilibrium and comparative statics
At equilibrium, quantity supplied equals quantity demanded, determining the equilibrium real interest rate.
Key directional conclusions (from the notes):
- Demand for loanable funds increases → real interest rate increases.
- Demand for loanable funds decreases → real interest rate decreases.
- Supply of loanable funds increases → real interest rate decreases.
- Supply of loanable funds decreases → real interest rate increases.
Crowding out (classic AP application)
Crowding out occurs when government borrowing increases (often due to a budget deficit), increasing demand for loanable funds and raising the real interest rate. Higher real interest rates reduce private investment, which matters for long-run growth because investment builds the capital stock.
Example: If the government increases spending without raising taxes, the budget deficit rises. In loanable funds:
- Demand shifts right
- Real interest rate rises
- Quantity of loanable funds rises (more saving is encouraged)
- Private investment is reduced relative to what it would have been
A nuance often tested: total borrowing can rise even while private investment falls, because government borrowing increases.
Exam Focus
- Typical question patterns:
- Use a loanable funds graph to show the effect of a budget deficit/surplus on the real interest rate.
- Use the mnemonics (FADE/SELF) to identify which curve shifts and why.
- Explain crowding out and connect it to lower private investment and long-run growth.
- Common mistakes:
- Using nominal interest rates instead of real interest rates in this model.
- Shifting supply instead of demand when the government runs a larger deficit.
Graph Skills and Multi-Graph Setups (What AP Free-Response Often Tests)
A major Unit 4 skill is coordinating multiple models so the directions of change stay consistent.
Money market + AD-AS (most common FRQ pairing)
A standard two-graph FRQ requires:
- Graph 1 (Money market): shift money supply or money demand, determine the change in the nominal interest rate.
- Graph 2 (AD-AS): use the interest rate change to infer investment changes, shift AD, and show changes in real GDP and price level.
Consistency rule: if your money market implies a lower interest rate, AD should shift right due to higher investment.
Loanable funds + money market (contrast and connections)
Some prompts test that you can distinguish:
- Loanable funds: determines the real interest rate via saving/borrowing (often fiscal/long-run context).
- Money market: determines the nominal interest rate via money supply and liquidity preference (often monetary policy context).
If expected inflation changes, connect real and nominal rates with the Fisher equation:
So if %%LATEX34%% is determined by loanable funds and %%LATEX35%% rises, nominal rates rise even if real rates do not.
How to write explanations (FRQ style)
AP graders reward clear causal language. A strong written chain names:
- The policy action (what the Fed does)
- The immediate financial variable (reserves/money supply)
- The interest rate result
- The investment response
- The AD shift
- The output and price level outcomes
Avoid vague phrases like “the economy improves.” Name the variable and direction.
Exam Focus
- Typical question patterns:
- Draw and label shifts in the money market and AD-AS after a Fed action.
- Use the Fisher equation to connect real and nominal interest rates.
- Write a step-by-step transmission mechanism explanation.
- Common mistakes:
- Drawing money supply as sloped (standard AP model uses a vertical money supply).
- Shifting AD the wrong direction after an interest rate change.
- Mixing which model uses real vs. nominal interest rates.
Real-World Complications (Know Them Without Overcomplicating AP Answers)
AP uses simplified models, but some questions test qualitative realism.
Excess reserves and weak multipliers
Banks may hold excess reserves when conditions are uncertain, borrowers are risky, or interest on reserves is attractive. When banks hold excess reserves, the actual increase in the money supply can be much smaller than the simple multiplier predicts.
The Fed targets interest rates
While AP graphs often show the Fed “setting the money supply,” modern central banks typically implement policy by targeting short-term interest rates. This still fits the money market model: to hit a rate target, the Fed supplies the quantity of reserves/money needed to reach that equilibrium.
Staying disciplined about nominal vs. real
- In the money market, talk about the nominal interest rate.
- In the loanable funds market, talk about the real interest rate.
If a prompt mixes inflation expectations with saving/borrowing, use the Fisher equation to translate between them.
Exam Focus
- Typical question patterns:
- Explain why the money multiplier might overpredict money supply growth.
- Interpret a scenario where the Fed changes policy but lending does not rise as expected.
- Distinguish nominal vs. real interest rates in the correct model.
- Common mistakes:
- Treating the multiplier as a guarantee rather than a maximum under assumptions.
- Using “real interest rate” and “nominal interest rate” interchangeably.