Mastering ACT Science: Critical Thinking and Data Analysis
Judging Validity of Scientific Information
The ACT Science test does not strictly test your memorization of scientific facts; rather, it tests your ability to think like a scientist. A crucial part of this is evaluating whether a study, experiment, or dataset is valid and reliable.
Experimental Design Basics
To evaluate validity, you must first identify the core components of the experiment:
- Independent Variable (IV): The variable the scientist changes or manipulates. Usually plotted on the $x$-axis.
- Dependent Variable (DV): The variable being measured or observed in response to the IV. Usually plotted on the $y$-axis.
- Controlled Variables (Constants): Factors kept the same across all trials to ensure that changes in the DV are caused only by the IV.
- Control Group: A baseline group that receives no treatment or a standard treatment, used for comparison.
Memory Aid:
DRY MIX
Dependent Responding Y-axis
Manipulated Independent X-axis
Reliability and Precision
An experiment is considered valid if the methods properly test the hypothesis and if the results are reproducible. Look for potential flaws when answering questions about validity:
- Sample Size: Small sample sizes are less reliable. An experiment testing 5 plants is less valid than one testing 500.
- Confounding Variables: If an external factor (like temperature in a reaction rate lab) wasn't controlled, the results may be invalid.
- Duration: Was the experiment run long enough to see a trend?
Formulating Conclusions from Data
Questions in this category ask you to summarize what the data actually says. You must look strictly at the provided charts, tables, and graphs—ignore outside knowledge unless specifically asked.
Identifying Trends and Relationships
Most conclusions rely on spotting mathematical relationships between variables.
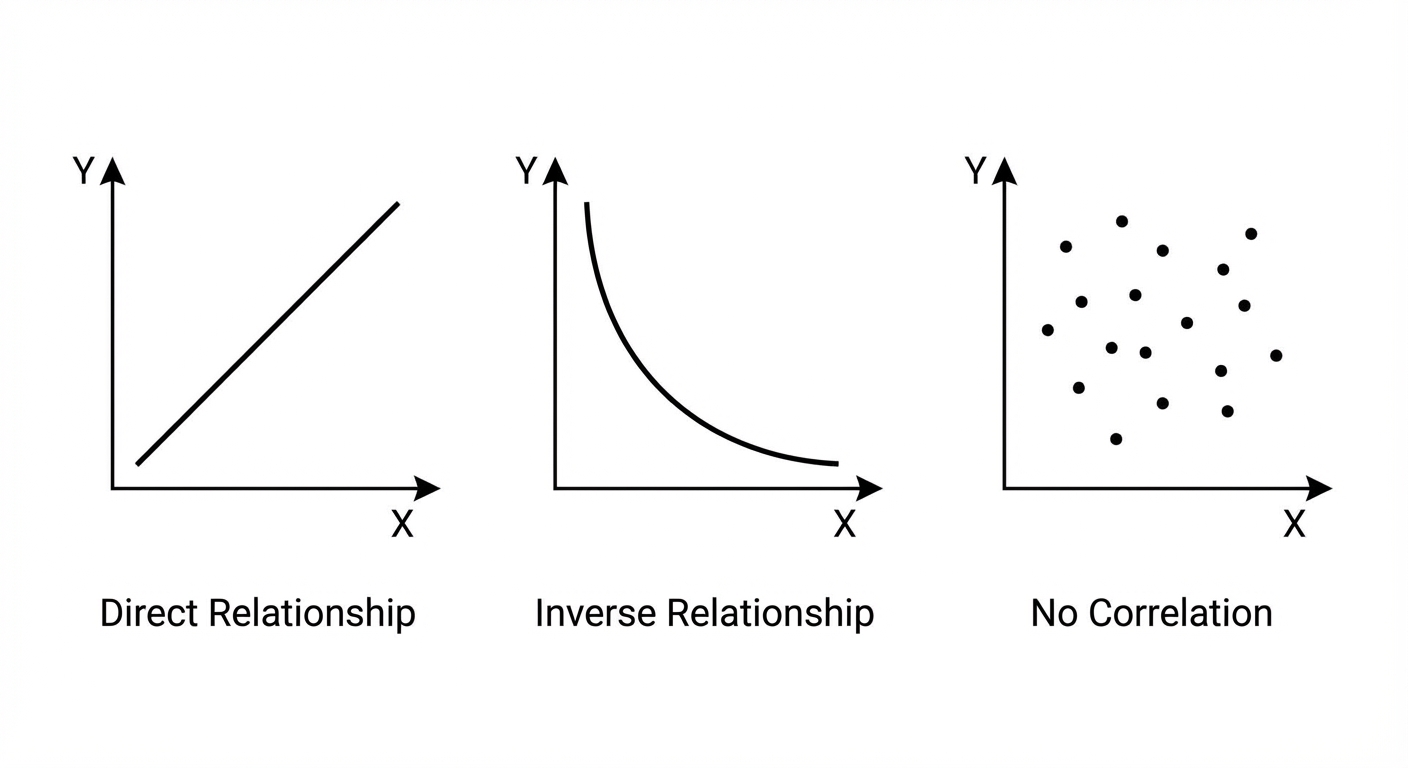
- Direct Relationship: As $x$ increases, $y$ increases. (Positive slope).
- Inverse Relationship: As $x$ increases, $y$ decreases. (Negative slope).
- No Relationship: Changes in $x$ have no consistent effect on $y$ (scattered or flat line).
Correlation vs. Causation
Just because two variables move together does not mean one causes the other.
- Correlation: A statistical association (e.g., Ice cream sales and shark attacks both rise in summer).
- Causation: Detailed evidence showing a mechanism (e.g., Heat causes ice cream to melt).
Key Rule: On the ACT, unless the text explains the mechanism (how it happens), assume you are observing a correlation, not a confirmed cause.
Making Predictions Based on Evidence
These questions often ask: "Suppose a new trial was conducted at…" or "Based on the trend…".
Interpolation vs. Extrapolation
Interpolation: Predicting a value inside the range of measured data points.
- Example: You have data for 10°C and 20°C. Predicting the value at 15°C is interpolation. It is generally very reliable.
Extrapolation: Predicting a value outside the measured range (beyond the graph).
- Example: You have data up to 100°C. Predicting the outcome at 150°C is extrapolation. This requires assuming the trend continues unchanged, which is a standard assumption on the ACT unless stated otherwise.

Worked Example: Graph Prediction
Scenario: A graph shows the solubility of Substance A in water.
- At 20°C, solubility is $30\text{ g}$.
- At 40°C, solubility is $50\text{ g}$.
- At 60°C, solubility is $70\text{ g}$.
Question: Predict the solubility at 50°C.
Solution:
- Identify the trend: Every 20°C increase results in a $20\text{ g}$ increase. The relationship is linear.
- Locate the target: 50°C is exactly halfway between 40°C and 60°C.
- Calculate: The midpoint between $50\text{ g}$ and $70\text{ g}$ is $60\text{ g}$.
Evaluating Competing Models and Hypotheses
This skill is central to the Conflicting Viewpoints passage (often called "Fighting Scientists"). You will read multiple hypotheses attempting to explain the same phenomenon.
Strategy: The "Three-Pass" Comparison
When evaluating models, do not try to determine which one is "factually correct" based on school knowledge. Treat them as arguments in a debate.
| Perspective | Key Question | What to look for |
|---|---|---|
| Mechanism | How do they think the process works? | Look for causation words (because, drives, results from). |
| Data Focus | What data do they emphasize? | Scientist A might focus on temperature; Scientist B on pressure. |
| Conflict | Where do they disagree? | Locate the specific sentence where their logic diverges. |
Determining Support for Inferences
You will often face questions framed as:
"Which hypothesis is best supported by the results of Experiment 2?"
To answer this, follow these steps:
- Identify the Claim: What is the hypothesis stating?
- Check the Data: Look at the specific table/graph mentioned.
- Match the Trend: Does the data move in the direction the hypothesis predicted?
The "Yes/No, Because…" Pattern
Many answer choices follow a strict logic structure:
- A. Yes, because data X is higher than data Y.
- B. Yes, because data X is lower than data Y.
- C. No, because data X is higher than data Y.
- D. No, because data X is lower than data Y.
Technique:
- Determine Yes or No first. (Eliminate two options).
- Verify the Because statement. Is the data description factually true according to the graph?
Common Mistakes & Pitfalls
- Ignoring the Labels: Students often rush and confuse the units (e.g., reading milliseconds as seconds) or axis labels.
- Using Outside Knowledge: If the passage says "the sky is green," for the purpose of that question, the sky is green. Do not use your biology memory to contradict the provided text.
- Confusing Variables: Mixing up the Independent Variable (what changed) with the Controlled Variable (what stayed the same).
- Over-Extrapolation: Assuming a trend continues forever. For example, enzyme activity increases with heat but drops sharply when the enzyme denatures. A linear extrapolation would fail here if the biological context implies limits.
- Misinterpreting "supported by": A hypothesis is supported if the data matches the prediction. It doesn't have to be proven 100% correct, just consistent with the specific data shown.