Unit 6: Market Failure and Government Interventions
Social Efficiency and Market Failure
In a perfectly competitive market free of government intervention, the market equilibrium is usually assumed to be efficient. However, Market Failure occurs when the free market fails to allocate resources efficiently, meaning the quantity produced does not maximize total social surplus.
To understand market failure, we must distinguish between private and social costs/benefits.
Key Concepts and Notation
- Marginal Private Cost (MPC): The cost for the producer to produce one additional unit (the Supply curve).
- Marginal External Cost (MEC): The uncompensated cost imposed on third parties (e.g., pollution).
- Marginal Social Cost (MSC): The total cost to society.
- Marginal Private Benefit (MPB): The benefit the consumer receives from one additional unit (the Demand curve).
- Marginal External Benefit (MEB): The uncompensated benefit spills over to third parties (e.g., herd immunity).
- Marginal Social Benefit (MSB): The total benefit to society.
The Golden Rule of Allocative Efficiency
A market is allocatively efficient (Socially Optimal) only when:
If the market equilibrium ($Q{market}$) differs from the socially optimal quantity ($Q{social}$), Deadweight Loss (DWL) exists. The government aims to intervene to push quantity toward the social optimum.
Externalities
An externality is a cost or benefit that affects a third party who did not choose to incur that cost or benefit. Externalities cause the market supply or demand curves to diverge from the social cost or benefit curves.
1. Negative Externalities (Spillover Costs)
These occur when a firm or consumer dumps costs onto society. The most common AP example is a Negative Production Externality (e.g., a factory polluting the air).
- Scenario: The firm only cares about its private costs ($MPC$). Society faces the private costs plus the pollution damage ($MSC$).
- Graph Analysis: The $MSC$ curve is above/to the left of the Supply curve ($MPC$).
- Outcome:
- $Q{market} > Q{social}$ (The market overproduces).
- $P{market} < P{social}$ (The good is underpriced).
- Deadweight Loss: Forms a triangle pointing toward the varying intersection points (social optimum). It represents the societal cost exceeding the societal benefit for the extra units produced.

Government Solution: To correct this, the government must reduce quantity. They impose a Per-Unit Tax equal to the marginal external cost ($Tax = MEC$). This shifts the MPC curve left until it aligns with the MSC curve, internalizing the externality.
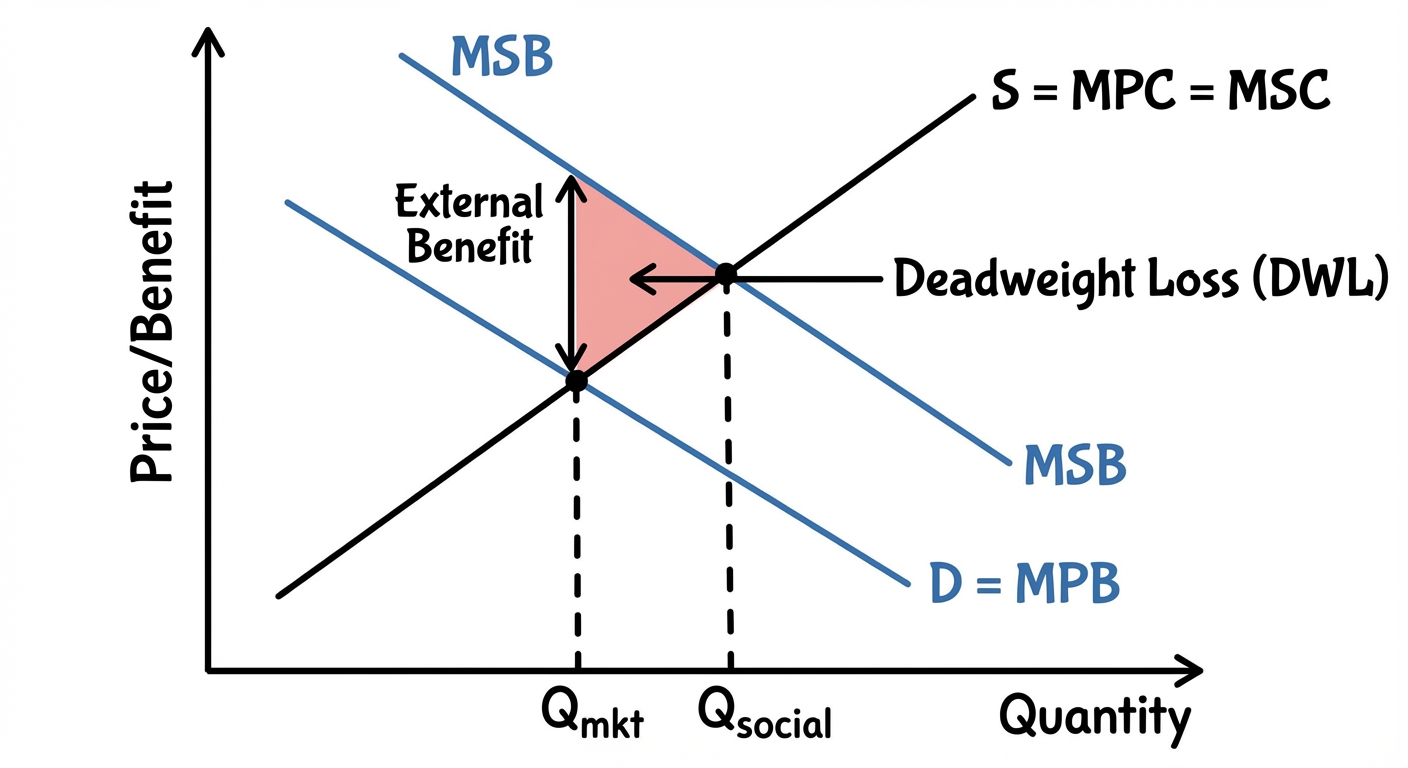
2. Positive Externalities (Spillover Benefits)
These occur when consumption or production creates benefits for others. The most common AP example is a Positive Consumption Externality (e.g., vaccines, education, fire alarms).
- Scenario: The consumer only considers their private benefit ($MPB$). Society gains the private benefit plus the external benefit ($MSB$).
- Graph Analysis: The $MSB$ curve is above/to the right of the Demand curve ($MPB$).
- Outcome:
- $Q{market} < Q{social}$ (The market underproduces).
- The market price is too low to incentivize the optimal amount of production.
- Deadweight Loss: Forms a triangle pointing toward the social optimum. It represents the potential societal welfare that was missed because those units were not produced.
Government Solution: To correct this, the government aims to increase quantity. They provide a Per-Unit Subsidy equal to the marginal external benefit ($Subsidy = MEB$). This lowers the cost for consumers or producers, shifting the demand or supply curve right until the market outcome matches the social optimum.
Comparison Table
| Feature | Negative Externality (Pollution) | Positive Externality (Vaccines) |
|---|---|---|
| Relationship | $MSC > MSB$ at $Q_{market}$ | $MSB > MSC$ at $Q_{market}$ |
| Curve Shift | $MSC > MPC$ (Supply gap) | $MSB > MPB$ (Demand gap) |
| Problem | Overproduction ($Q{mkt} > Q{soc}$) | Underproduction ($Q{mkt} < Q{soc}$) |
| Remedy | Per-Unit Tax | Per-Unit Subsidy |
Public and Private Goods
Goods are categorized based on two specific criteria. Understanding these definitions is vital for multiple-choice sections.
Defining Characteristics
- Rivalry in Consumption:
- Rival: One person's consumption reduces the amount available for others (e.g., eating a slice of pizza).
- Non-Rival: One person's consumption does not affect others' ability to consume it (e.g., watching a sunset).
- Excludability:
- Excludable: The supplier can prevent those who don't pay from consuming the good.
- Non-Excludable: It is impossible (or too costly) to stop non-payers from using the good.
The Four Types of Goods
| Rival | Non-Rival | |
|---|---|---|
| Excludable | Private Goods (Ice cream, Shoes) Efficiently provided by markets. | Club Goods (Artificially Scarce) (Netflix, Cable TV, Empty Toll Roads) Natural Monopolies often arise here. |
| Non-Excludable | Common Resources (Fish in the ocean, Public pasture) Suffer from Tragedy of the Commons. | Public Goods (National Defense, Lighthouse) Suffer from Free Rider Problem. |
Market Failures in Public Goods & Common Resources
1. Public Goods & The Free-Rider Problem
Because public goods are non-excludable, people can consume them without paying. This creates the Free-Rider Problem.
- Since firms cannot easily charge for the good, private markets will produce zero (or very little) of it, even if society wants it.
- Solution: The government collects compulsory taxes to fund the provision of the good.
2. Common Resources & The Tragedy of the Commons
Because common resources are rival but non-excludable, individuals act in their own self-interest to consume as much as possible before it runs out.
- Users ignore the cost they impose on future users (a negative externality).
- Result: The resource is depleted or destroyed.
- Solution: Quotas, privatization (assigning property rights), or licenses.
Common Mistakes & Pitfalls
- Lump-Sum vs. Per-Unit:
- A Lump-Sum tax/subsidy only effects Fixed Costs. It does not change Marginal Cost! Therefore, it does not change the profit-maximizing quantity or fix the externality.
- Only Per-Unit policies shift the MC curve and change Quantity.
- Identifying Deadweight Loss (DWL):
- Students often shade the wrong area. Tip: The DWL triangle always points to the Socially Optimal Quantity ($Q_{social}$). If the market quantity is left of the optimum, the triangle points right. If right of optimum, it points left.
- Confusion over "Public":
- Do not assume a good is a "Public Good" just because the government provides it.
- Example: Public schools are provided by the government, but they are technically Private Goods (or quasi-public) because desks are rival and the school could exclude students. True Public Goods (National Defense) are strictly non-rival and non-excludable.
- Coase Theorem Misapplication:
- Private parties can solve externalities without government only if transaction costs are low and property rights are clear. If bargaining is expensive (e.g., 1 factory vs. 10,000 residents), private negotiation fails.