Mastering Scientific Investigation Principles for the ACT Science Test
Understanding Experimental Tools and Procedures
The Scientific Investigation category on the ACT Science test asks you to understand the tools used in an experiment and the logic behind the procedural steps. You do not need to memorize specific lab manuals, but you must be able to infer functionality from the passage descriptions.
The Role of Apparatus
Every passage describing an experiment will list the equipment (apparatus) used. You must identify why specific tools were chosen.
- Precision Tools: Instruments like graduated cylinders, electronic balances, or calipers are used to measure specific quantities (volume, mass, length) with high precision.
- Environment Controllers: Items like hot plates, ice baths, or vacuum chambers are used to manipulate the environment to test a hypothesis.
Key Skill: If the text states, "A calorimeter was used to capture heat released," you identify the tool (calorimeter) and its specific function (measuring heat transfer).
Procedural Logic
The ACT often asks questions like, "Why did the scientist wait 5 minutes between trials?" or "Why was the mixture stirred constantly?"
Common reasons for specific procedures include:
- Ensuring Equilibrium: Waiting for a reaction to settle or temperature to stabilize.
- Homogeneity: Stirring ensures the solution is mixed evenly so samples are representative.
- Cleaning/Flushing: Rinsing containers prevents cross-contamination between trials.
Identifying Controls and Variables
This is the most critical concept in the Scientific Investigation section. You must isolate exactly what is changing, what is being measured, and what remains static.

The Independent Variable (IV)
The Independent Variable is the factor that the scientist intentionally changes or manipulates. It is the "cause."
- Graph Location: Almost always plotted on the $x$-axis.
- Table Location: Usually the first column(s) on the left.
- Mnemonic: Think "I" change it.
The Dependent Variable (DV)
The Dependent Variable is the factor being measured or observed in response to the IV. It is the "effect."
- Graph Location: Plotted on the $y$-axis.
- Table Location: Usually the columns on the right.
- Mnemonic: D = D (The Dependent variable depends on the Data collector).
Controlled Variables (Constants)
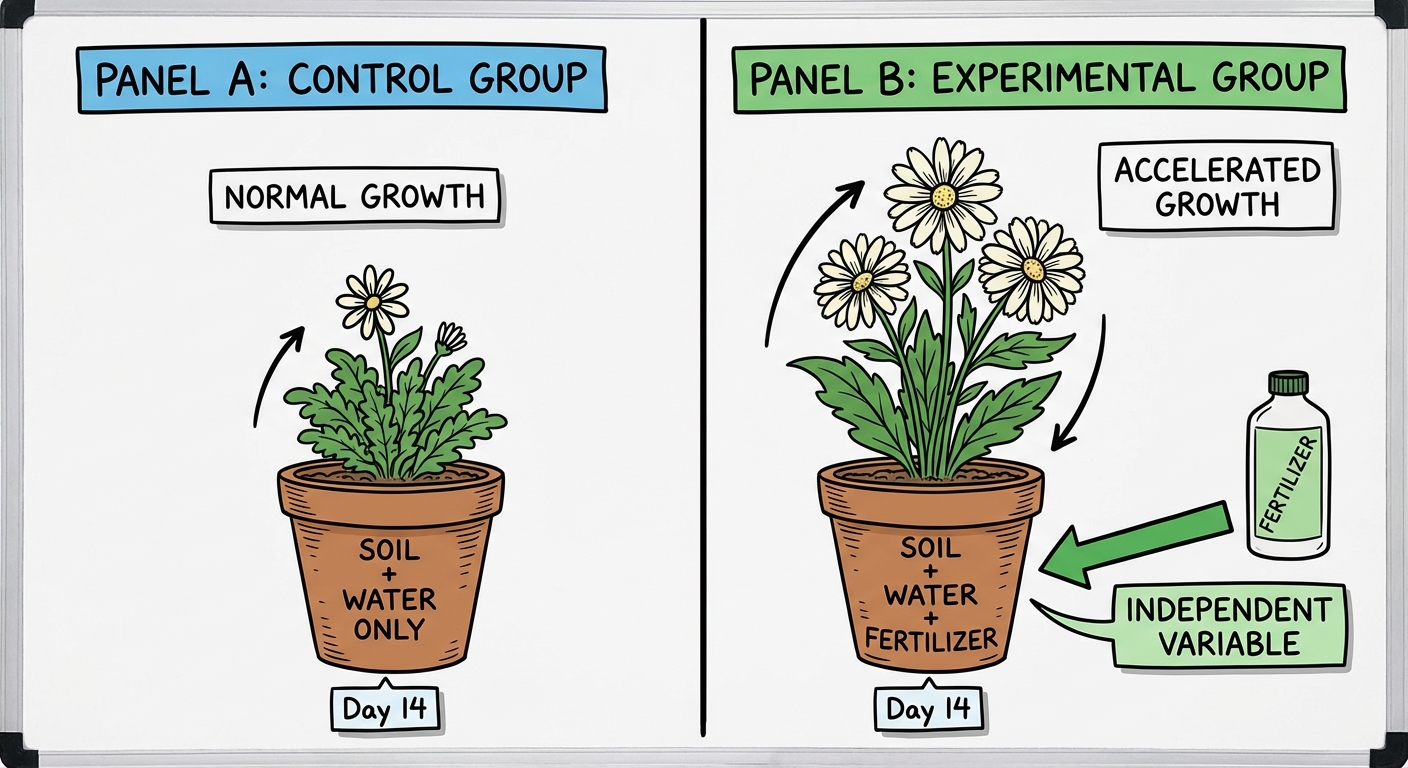
Controlled Variables are factors that are kept exactly the same across all trials to ensure a fair test. If a scientist is testing how temperature affects plant growth, the amount of water, soil type, and sunlight must remain constant.
The "Control Group"
A Control Group is a specific trial used as a baseline standard for comparison. It typically represents "normal" conditions (e.g., a plant receiving no fertilizer) to show what happens in the absence of the experimental treatment.
Note: Do not confuse Controlled Variables (constants) with a Control Group (a baseline trial).
Analyzing Experimental Design
Questions in this category ask you to critique or explain the structure of the study. You need to distinguish between a valid experiment and a flawed one.
Validity and Bias
For an experiment to be valid, it must measure what it claims to measure without outside interference.
- Single Variable Rule: A valid experiment changes only one independent variable at a time. If a student changes both the temperature and the pressure in the same trial, they cannot determine which factor caused the change in the results.
- Sample Size: Larger sample sizes generally reduce the effect of outliers and random errors.
Identifying Flaws
You may be asked to identify a weakness in the design. Common weaknesses include:
- Lack of Control: Failing to establish a baseline.
- Confounding Variables: Accidental changes in variables that should have been constants (e.g., testing solar panels on cloudy days vs. sunny days without accounting for light intensity).
- Measurement Error: Using tools with insufficient precision (e.g., using a ruler to measure a bacterial cell).
Comparing and Extending Experiments
ACT passages often present two or three related experiments (e.g., Experiment 1, Experiment 2) or different studies by different students. You must be able to cross-reference data.
Comparing Conditions
Look for the difference between the setups.
- Example: "In Experiment 1, the solution was acidic ($pH < 7$). In Experiment 2, the solution was basic ($pH > 7$)."
- Question Strategy: If the question asks, "How did the results differ between Exp. 1 and Exp. 2?", first identify the single variable that changed between the two experiments, then look at how the DV responded.
Changing the Setup
Sometimes a question will ask: "Suppose the scientist repeated Experiment 1, but used a 50g block instead of a 10g block. Which variable would change?"
To answer this:
- Identify the new variable (Mass).
- Determine if Mass was an IV, DV, or Constant in the original experiment.
- Predict the specific effect based on the trends established in the data.
Predicting Results of Additional Trials
This skill involves looking at the established trend in the data and determining the value of a hypothetical new trial.
Interpolation vs. Extrapolation
Interpolation: Predicting a value between two known data points.
- Example: If Trial 1 (10 min) = 50°C and Trial 2 (20 min) = 70°C, what is the temp at 15 min?
- Logic: It is likely roughly halfway between, ~60°C.
Extrapolation: Predicting a value outside the known range (future trends).
- Example: If volume increases by 5mL for every 10°C, and the highest data point is 100°C, what happens at 120°C?
- Logic: Continue the pattern linearly.
Trend Identification
Before predicting, define the relationship:
- Direct Variation: As $x$ increases, $y$ increases.
- Inverse Variation: As $x$ increases, $y$ decreases.
- Thresholds: Be careful of limits. Water boils at 100°C. If you heat it from 90°C to 110°C, the water temp technically stops rising at 100°C (phase change) unless it is under pressure. Watch for physical limitations in the scenario.
Common Mistakes & Pitfalls
1. Confusing Correlation with Causation
Just because two variables change together doesn't mean one caused the other. However, in an experimental setting where variables are strictly controlled, we can usually infer causation. In observational studies (like counting bird populations), be more careful.
2. Mixing Up Independent and Dependent Variables
Mistake: Thinking time is always the independent variable.
Correction: While time is often the IV (x-axis), scientists can measure how long it takes for a reaction to finish. in that case, Time is the DV (y-axis).
3. Ignoring the Scale
Mistake: Assuming the distance between bars or grid lines represents equal intervals without checking.
Correction: Always check the axis increments. One graph might jump by 10s ($0, 10, 20$) while another jumps by 100s ($0, 100, 200$).
4. Overlooking the Unit Labels
Mistake: Predicting a result in meters when the graph is in centimeters.
Correction: Always verify units in the answer choices against the units in the table headers or axis labels. If the graph uses $mL$ and the answer asks for $L$, you must convert ($1000 mL = 1 L$).