Analyzing Function Behavior and Real-World Optimization
Connecting Graphs of f, f', and f''
One of the most frequent tasks in AP Calculus AB is deciphering the behavior of a function based on the graph of its derivative, or vice versa. To master this, think of the derivative not just as a mathematical operation, but as a language that describes shape and rate of change.
The Hierarchy of Function Behavior
To successfully analyze these graphs, you must understand the "Translation Dictionary" between a function $f$, its derivative $f'$, and its second derivative $f''$.
| Function ($f$) Feature | First Derivative ($f'$) Behavior | Second Derivative ($f''$) Behavior |
|---|---|---|
| Increasing $\nearrow$ | Positive ($f'(x) > 0$) | (Not directly linked to sign) |
| Decreasing $\searrow$ | Negative ($f'(x) < 0$) | (Not directly linked to sign) |
| Relative Extrema (Peak/Valley) | Equals $0$ or Undefined (Changes sign) | (Used for 2nd Deriv. Test) |
| Concave Up $\cup$ | Increasing | Positive ($f''(x) > 0$) |
| Concave Down $\cap$ | Decreasing | Negative ($f''(x) < 0$) |
| Point of Inflection (POI) | Relative Extrema (Peaks/Valleys) | Equals $0$ or Undefined (Changes sign) |
Analyzing the Graphs Visually
When you are given a graph of $f'$ and asked about $f$, remember that $f'$ plots the slope of $f$.
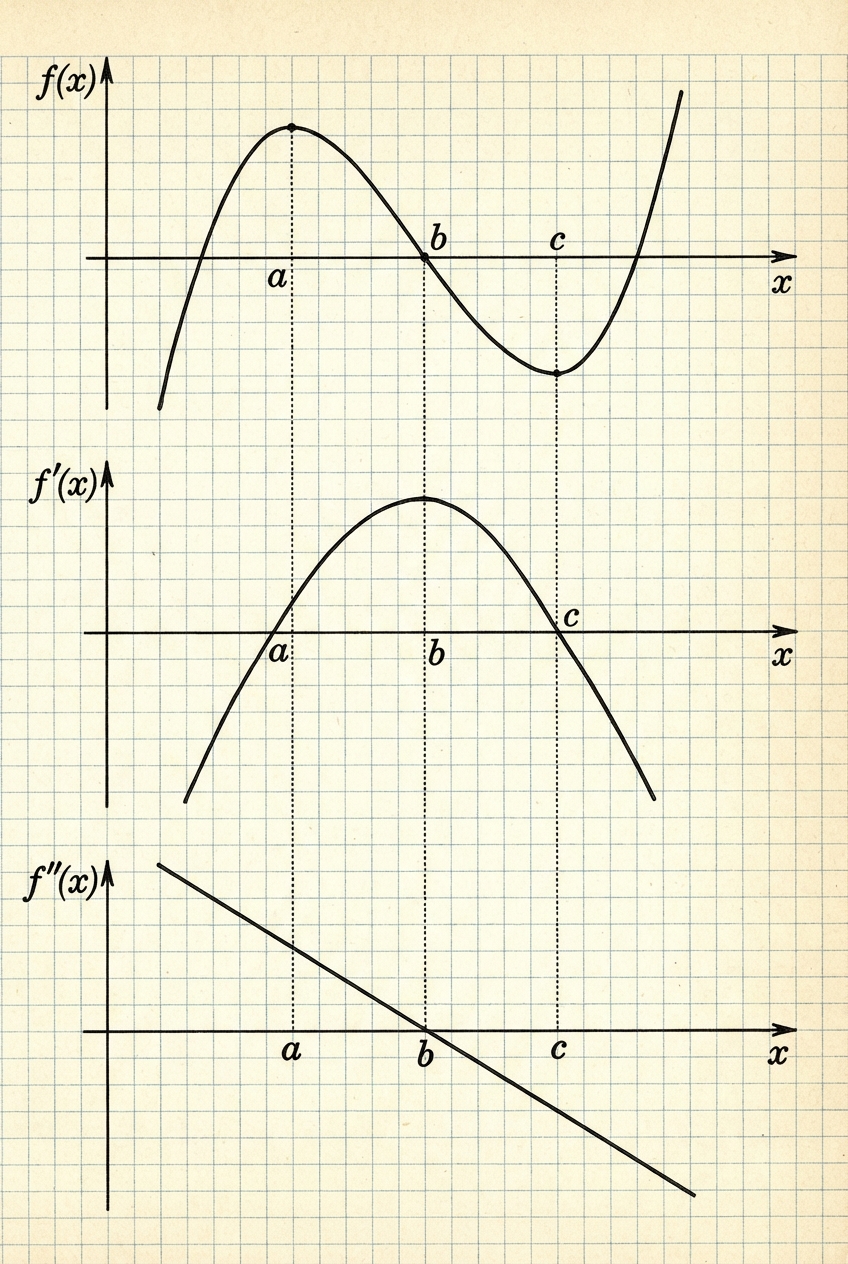
Reading $f'$ to find $f$'s Extrema:
Look for where the graph of $f'$ crosses the x-axis (x-intercepts).- If $f'$ changes from positive to negative, $f$ has a relative maximum.
- If $f'$ changes from negative to positive, $f$ has a relative minimum.
- If $f'$ touches the x-axis but does not cross (does not change sign), $f$ has a plateau, not an extremum.
Reading $f'$ to find $f$'s Concavity:
Look at the slope of the $f'$ graph.- Where $f'$ is going up (increasing), $f$ is Concave Up.
- Where $f'$ is going down (decreasing), $f$ is Concave Down.
- The peaks and valleys of $f'$ correspond to the Points of Inflection of $f$.
Sketching Graphs of Functions and Their Derivatives
Curve sketching combines limits, derivatives, and algebra to draw an accurate representation of a function without relying on a calculator. While AP exams often focus on analyzing given graphs, you may be asked to sketch a curve satisfying specific criteria.
The Curve Sketching Verification List
Before determining the shape, gather the "anchors" of the graph:
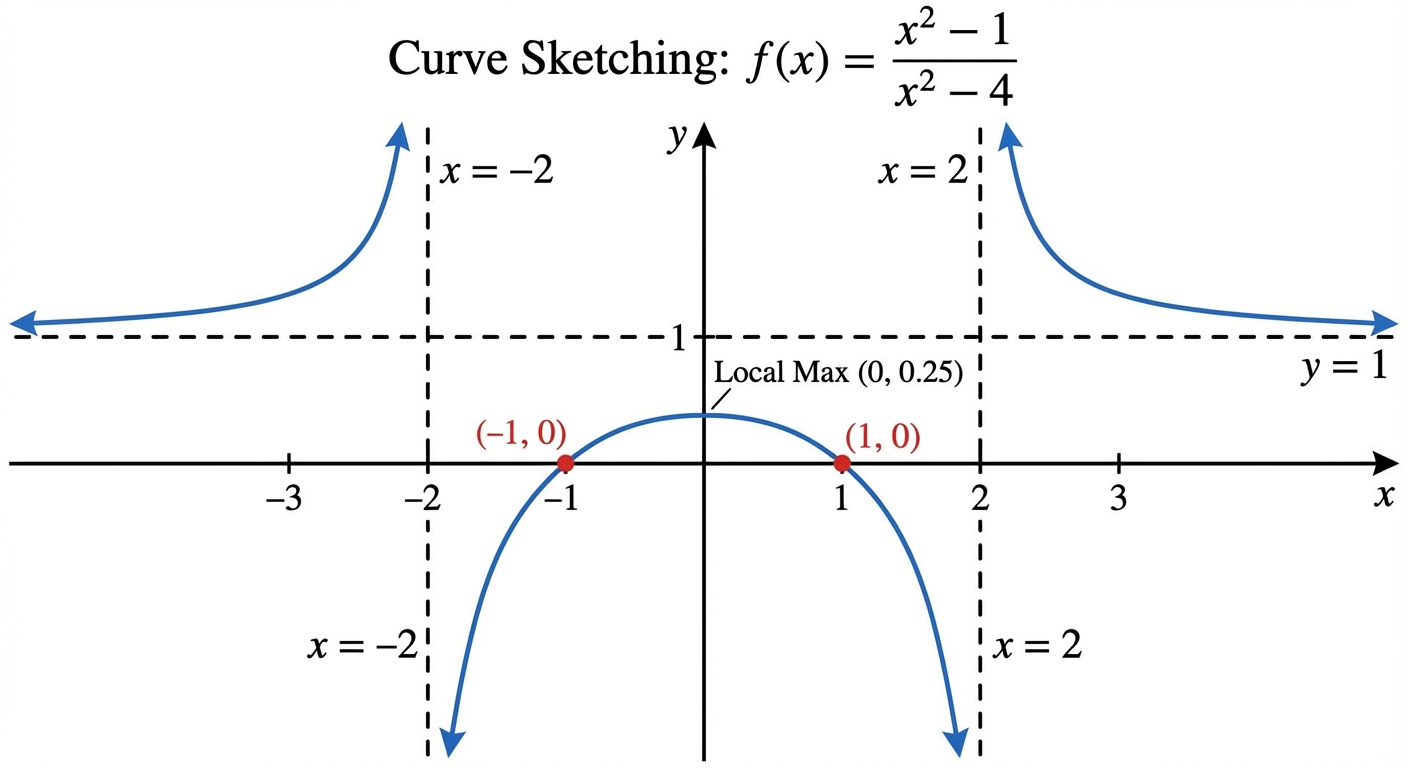
- Domain & Discontinuities: Identify vertical asymptotes (where denominator = 0) and holes.
- Intercepts: Solve $f(0)$ for y-intercepts and $f(x)=0$ for x-intercepts.
- End Behavior: Use limits at infinity: $\lim_{x \to \pm\infty} f(x)$ to find horizontal asymptotes.
- Symmetry: Check for even ($f(-x) = f(x)$) or odd ($f(-x) = -f(x)$) symmetry.
The Sign Chart Method
Once the anchors are found, use derivatives to determine the shape.
- Find Critical Points: Solve $f'(x) = 0$ or undefined.
- Make a Sign Chart for $f'$: Test intervals between critical points to determine increasing/decreasing behavior.
- Find Possible Inflection Points: Solve $f''(x) = 0$ or undefined.
- Make a Sign Chart for $f''$: Test intervals to determine concavity.
Example: Sketching a Polynomial
Consider $f(x) = x^3 - 3x^2$.
- Intercepts: $(0,0)$ and $(3,0)$.
- $f'(x) = 3x^2 - 6x = 3x(x-2)$. Critical points at $x=0, x=2$.
- $f'$ is pos $\to$ neg $\to$ pos. ($f$ increases, decreases, increases).
- Max at $x=0$, Min at $x=2$.
- $f''(x) = 6x - 6$. Possible POI at $x=1$.
- $f''$ is neg $\to$ pos. ($f$ is Concave Down then Up).
- POI at $x=1$.
Optimization Problems
Optimization is the process of finding the "best" value—maximum profit, minimum cost, minimum surface area—within a given domain. These are quintessential real-world applications of the derivative.
The General Strategy
- Visualize: Draw a picture and label all known and unknown quantities.
- Primary Equation: Write the formula for the quantity you want to maximize or minimize (the "Objective Function").
- Constraint: Find a secondary equation that relates the variables (e.g., a fixed amount of fencing, a fixed volume).
- Substitution: Use the constraint to rewrite the Primary Equation in terms of one single variable.
- Domain: Determine the feasible interval $[a, b]$ for that variable.
- Calculus: Find the derivative, set it to zero (find critical points), and test them.
The Candidates Test (Closed Interval Method)
If the problem implies a closed interval (e.g., $x$ must be between 0 and 10), you must use the Candidates Test to justify your answer on the AP Exam.
- Find critical numbers $c$ inside interval $[a, b]$.
- Evaluate the function $f(x)$ at:
- The endpoints $a$ and $b$.
- The critical numbers $c$.
- Compare the values. The largest is the Absolute Max; the smallest is the Absolute Min.
Worked Example: Fencing a Rectangular Pasture
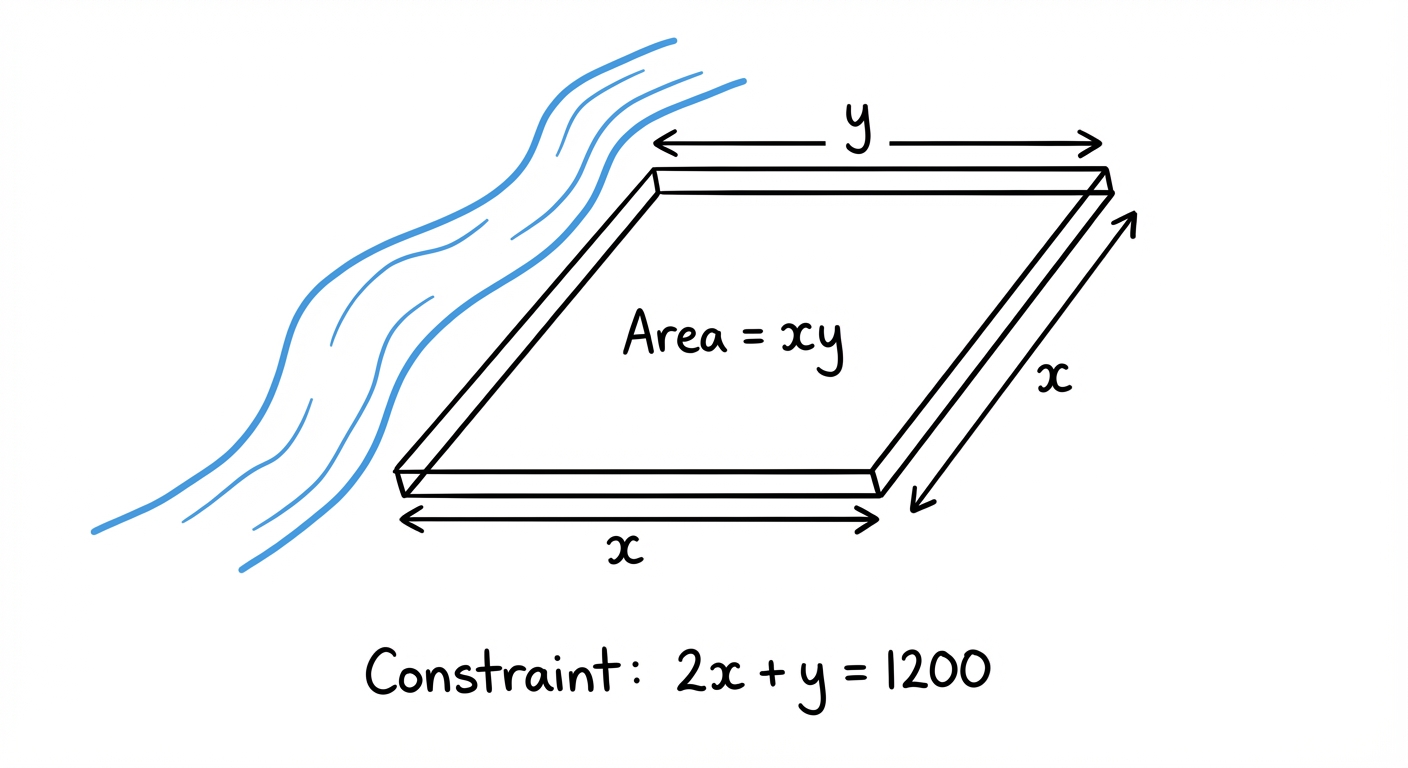
Problem: A farmer has 1200 meters of fencing and wants to enclose a rectangular plot that borders a straight river. No fencing is needed along the river. What dimensions maximize the area?
- Draw: A rectangle with sides $x$ (perpendicular to river) and $y$ (parallel to river).
- Primary Equation: Maximize Area $A = xy$.
- Constraint: $2x + y = 1200$.
- Substitute: Solve constraint for $y$: $y = 1200 - 2x$.
Substitute into Area: $A(x) = x(1200 - 2x) = 1200x - 2x^2$. - Domain: $x$ must be positive, and $y$ must be positive.
If $y=0, x=600$. So, $x \in [0, 600]$. - Differentiate:
- Verify (Candidates Test):
- $A(0) = 0$
- $A(600) = 600(0) = 0$
- $A(300) = 300(1200 - 600) = 300(600) = 180,000$
Conclusion: The dimensions $x=300m$ and $y=600m$ yield the maximum area of $180,000 m^2$.
Common Mistakes & Pitfalls
Confusing "Defined" with "Zero":
Students often think $f'(x)=0$ is the only place an extrema can exist. Do not forget points where $f'(x)$ is undefined (sharp corners or cusps) are also critical points and must be tested.The "False" Inflection Point:
Just because $f''(c) = 0$, it does not guarantee an inflection point (e.g., $y=x^4$ at $x=0$). You must verify that $f''$ actually changes sign (from $+$ to $-$ or vice versa) at that point.Forgetting Optimization Endpoints:
In optimization problems, the maximum or minimum might occur at the very beginning or end of the interval, not necessarily at the peak of the curve. Always check endpoints if the interval is closed.Mixing up $f$, $f'$, and $f''$:
A common error is looking at a graph of $f'$ and identifying the peaks of $f'$ as the maximums of $f$. The peaks of $f'$ are actually the inflection points of $f$. Always label your axes immediately and ask: "Am I looking at position, slope, or concavity?"