Mastering Information and Ideas on the Digital SAT
The Information and Ideas domain on the Digital SAT Reading and Writing section accounts for approximately 26% of the questions you will face. Unlike the Craft and Structure domain, which asks how a text is built, this domain asks what the text says, implies, and proves.
This section tests your ability to locate, interpret, evaluate, and integrate information from texts and informational graphics (tables, bar graphs, and line graphs). Success here relies on strict logical deduction and precise reading comprehension.
Central Ideas and Details
These questions ask you to identify the big picture or specific facts within a passage. They are the bedrock of reading comprehension.
Defining the Concepts
- Central Idea: The "big picture" or the primary point the author wants the reader to take away. It is an overarching summary that covers the entire text, not just one part.
- Detail: A specific fact, descriptions, or piece of evidence used to support the central idea.
Strategy: The "So What?" Test
When faced with a "What is the main idea?" question, ask yourself: "So what? What is the author trying to tell me about this topic?"
- Ignore the Trap of "True but Narrow": The most common distractor (wrong answer) is a choice that is factually true according to the text but focuses on a minor detail rather than the whole passage.
- Summarize First: Before looking at the answers, summarize the text in one sentence. Match your summary to the choices.
| Feature | Central Idea | Supporting Detail |
|---|---|---|
| Scope | Broad (covers the whole text) | Narrow (covers one sentence or phrase) |
| Function | The thesis or argument | Evidence or context |
| Trap | Too vague | Too specific |
Example Scenario
Text: "While bees are known for making honey, their most vital economic contribution is pollination. Without bees transferring pollen between flowers, crop yields for apples, almonds, and avocados would plummet, causing significant food shortages and economic loss based on current agricultural models."
- Detail: Bees make honey; bees pollinate apples.
- Central Idea: Bees are economically crucial primarily due to their role in pollination and food security.
Inferences
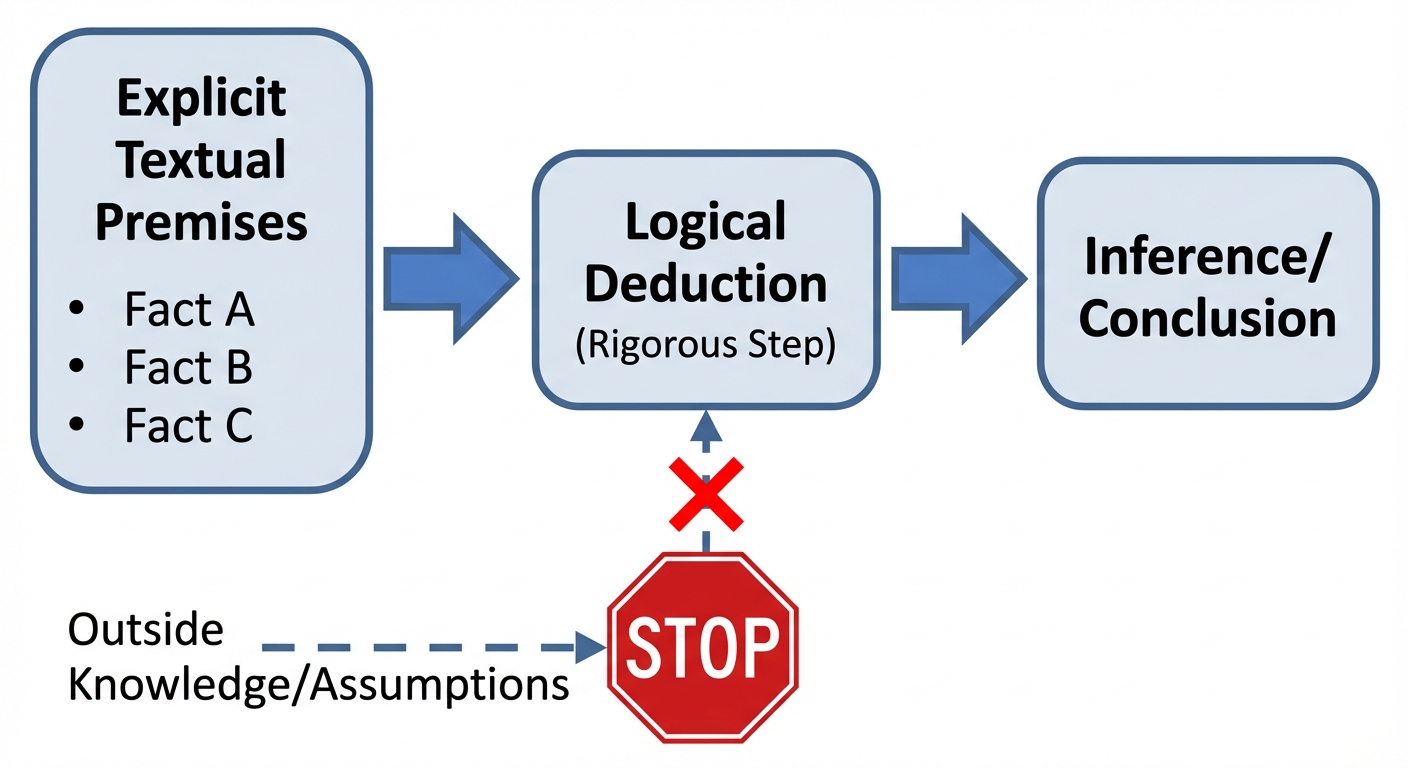
Inference questions on the SAT ask you to derive a logical conclusion from the provided text. The prompt often looks like this: "Which choice most logically completes the text?" or "Which choice is the most logical inference based on the text?"
The Rules of SAT Inferences
In a literature class, an inference might involve creative interpretation or reading "between the lines." On the SAT, an inference must be a watertight logical deduction.
- It is not a guess.
- It is not a prediction of the future (unless the text establishes a trend).
- It is a statement that MUST be true if the premises in the text are true.
Strategy: The Puzzle Piece Match
Treat the text like an incomplete equation: $A + B = \text{?}$
- Identify the Premises: Find the facts explicitly stated.
- Find the Bridge: Look for transition words (however, therefore, consequently) that signal the relationship between ideas.
- Eliminate Extreme Language: Avoid answers with words like always, never, everyone, or impossible unless the text is equally extreme.
Common Pitfall: Bringing in outside knowledge. If the text discusses checking accounts in 1990, do not use your knowledge of modern banking apps to answer the question. Stick strictly to the provided text.
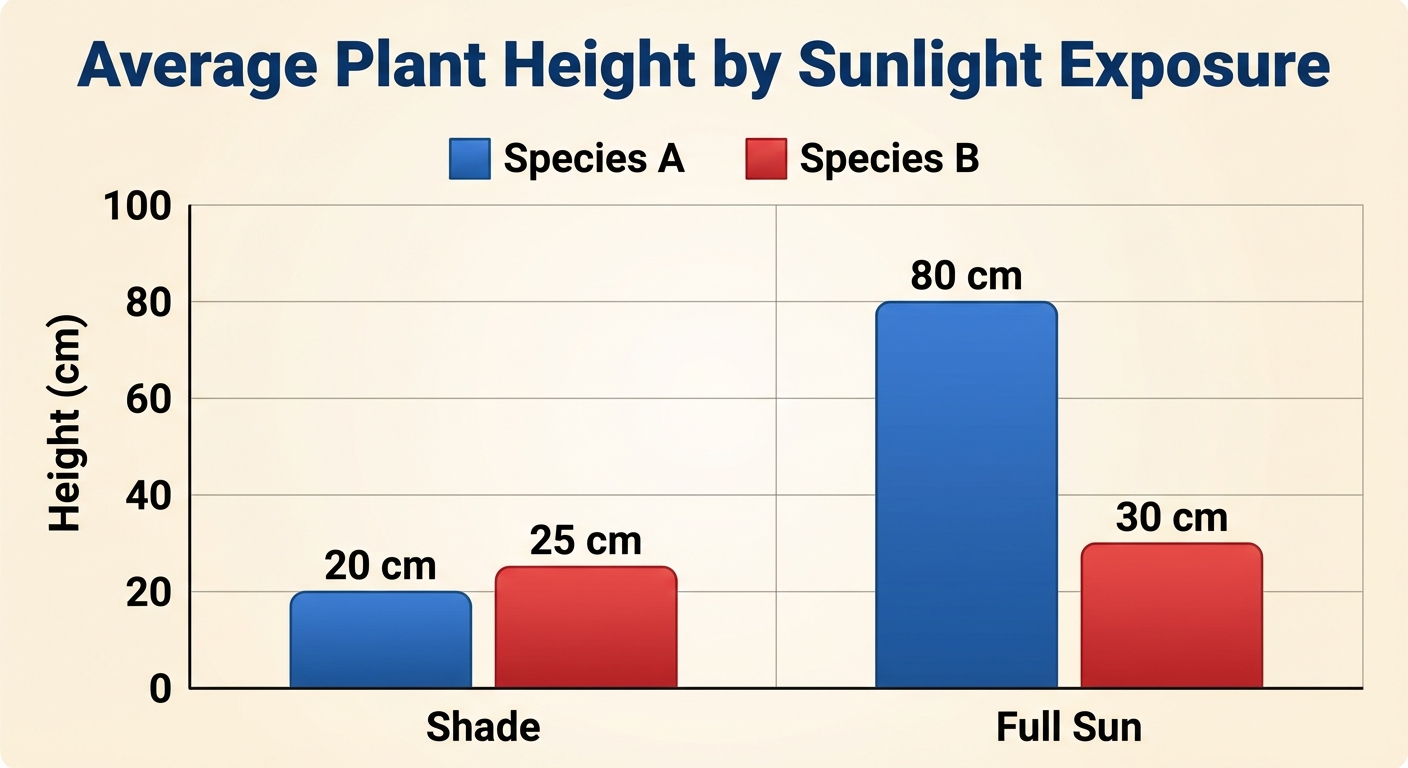
Command of Quantitative Evidence
These questions present a short text alongside an informational graphic (bar chart, line graph, scatterplot, or table). You will typically be asked to complete a sentence in the text using data from the graphic.
How to Read SAT Graphics
Do not rush to the numbers. Follow this order of operations:
- Read the Title: This tells you the context.
- Read the Axes/Labels: Understand the variables. Is the Y-axis absolute numbers or percentages? Is the X-axis years or categories?
- Read the Key/Legend: Distinguish between different data sets.
- Read the Question: Determine what the argument needs (e.g., does the argument need data that supports a rise or a fall?).
Completing the Argument
The text usually presents a hypothesis or a claim. Your job is to pick the data point that validates (or sometimes refutes) that claim.
Structure of the Question:
"Researcher X claims that [Theory]. Which choice most effectively uses data from the graph to support this claim?"
Strategy:
- Identify the specific claim (e.g., "Species A grows faster than Species B in hot climates").
- Look at the graph specifically for "Species A" and "Species B" in the "Hot" category.
- Select the answer choice that accurately reflects that specific data point.
Command of Textual Evidence
These questions ask you to cite specific sentences or phrases to support a claim. On the digital SAT, this often appears in two formats: Literature/History (supporting a character analysis or historical argument) or Scientific (supporting a hypothesis).
1. Literary/Historical Evidence
- The Task: You are given a claim about a character, setting, or event. You must pick the quotation that illustrates this claim.
- Example:
- Claim: The character is fastidious and obsessed with order.
- Correct Evidence: "He spent twenty minutes aligning the pencils on his desk until they were perfectly parallel."
- Incorrect Evidence: "He worked hard at his job every day."
2. Scientific/Argumentative Evidence
- The Task: You are presented with a scientific hypothesis. You must identify which finding, if true, would support (or weaken) that hypothesis.
- The Logic:
- Support: If Hypothesis $X$ says "Variable A causes Variable B," look for evidence where A increases and B increases.
- Weaken: Look for evidence where A increases, but B stays the same or decreases.
Strategy: The Prediction Method
Before reading the answer choices (which can be long and confusing), predict what the evidence needs to look like.
- If the text says "The poet broke from traditional rhyme schemes," you search for a poem excerpt that does not rhyme.
- If the hypothesis is "Algae blooms reduce oxygen levels," you look for data showing high algae = low oxygen.
Common Mistakes & Pitfalls
1. The "Half-Right" Trap
Especially in Central Idea questions, the SAT loves answers where the first half is perfect, but the second half adds a detail not found in the text. If any part of the answer is unsupported, the whole answer is wrong.
2. Misinterpreting the Graph Axes
A classic mistake in Quantitative Evidence is confusing Rate of Change with Total Amount. If a graph shows the rate of population growth is declining, the population might still be growing (just slower). Always check the units on the Y-axis.
3. Strength of Language Errors
In Inference questions, avoid strong assertions like "proven," "undeniably," or "best." The SAT prefers softer, safer logical conclusions like "suggests," "likely," or "plausible," unless the text itself is absolute.
4. Answering a Different Question
Make sure you check if the question asks to support, weaken, or merely illustrate a claim. Using evidence that supports a claim when the question asked you to weaken it is a frequent error caused by reading too fast.